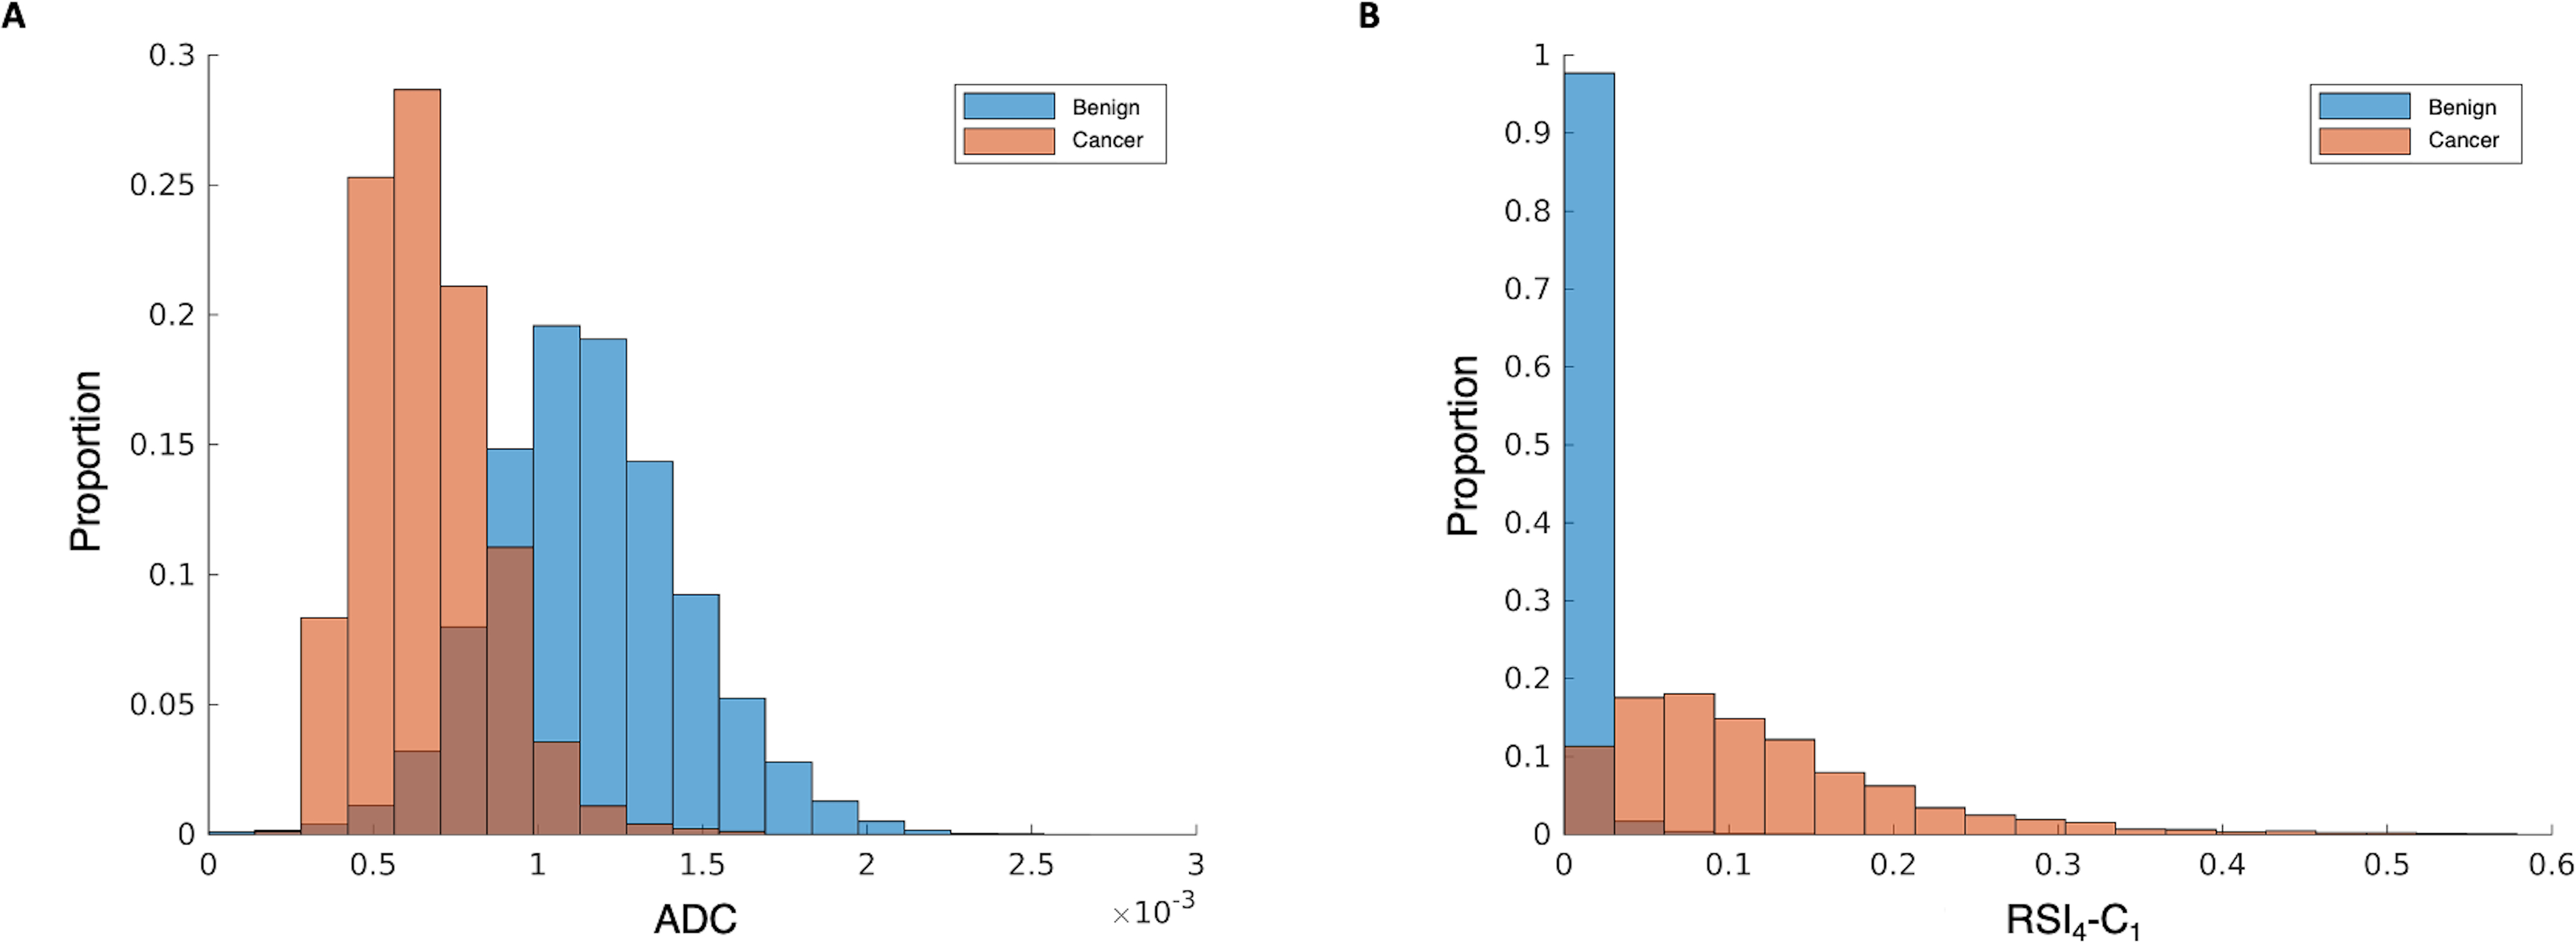
Figure 3.

Normalized histograms of signal intensity for A) conventional ADC and B) RSI4-C1. Benign voxels are shown in blue and cancer voxels are in orange, with the overlapping regions in brown. RSI4-C1 has less overlap in the distribution of benign and cancer voxels compared to ADC.
