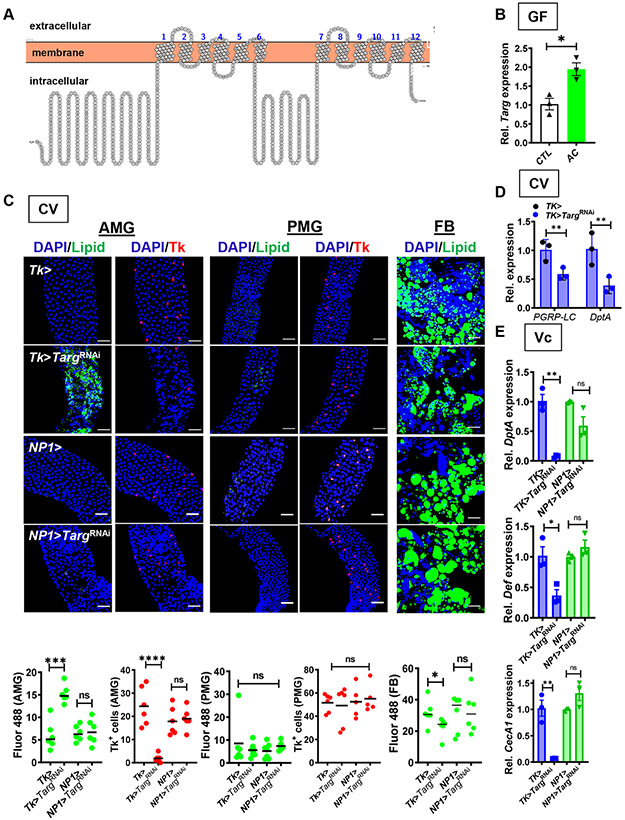
Figure 1: Targ RNAi in Tk+ EECs recapitulates the GF fly phenotype.
(A) Predicted structure of Targ. (B) RT-qPCR quantification of Targ in GF flies alone or supplemented with acetate (AC). (C) Representative micrographs (above) and quantification (below) of Bodipy staining (Lipid) and Tk immunofluorescence in the AMG, PMG, and FB of CV Tk>, NP1>, Tk>TargRNAi, and NP1>TargRNAi flies. (D) Quantification of PGRP-LC and DptA transcription in the intestines of CV flies with the indicated genotype. These data were collected in tandem with Fig S4C and utilize the same control. (E) Intestinal RT-qPCR quantification of DptA, Def, and CecA1 in the setting of oral V. cholerae infection of CV flies with the indicated genotype. The mean measurement is indicated. Error bars represent the standard deviation. A student’s t-test was used to evaluate significance. ns not significant, *p<0.05, **p<0.01, ***p<0.001, ****p<0.0001. See also Fig S1 and S2.

