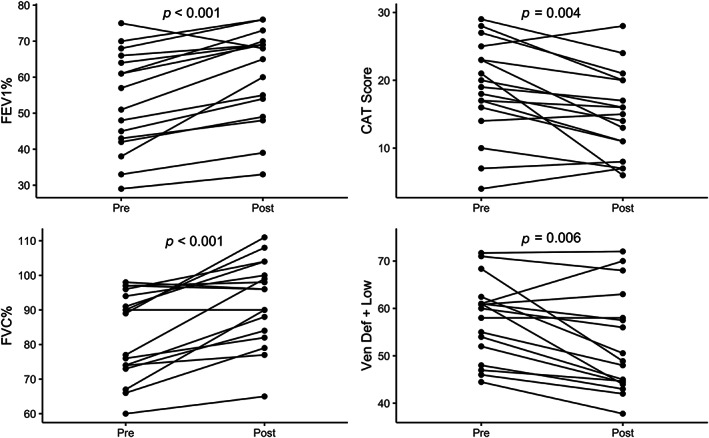
FIGURE 3.

Clinical and ventilation metrics with significant changes following therapy. Each quadrant contains one of the four metrics that changed significantly following therapy. Values from each individual subject are shown before and after therapy, connected by a line. Significance: FEV1%, P < 0.001; CAT, P = 0.004; FVC%, P < 0.001, vendef + low, P < 0.006).
