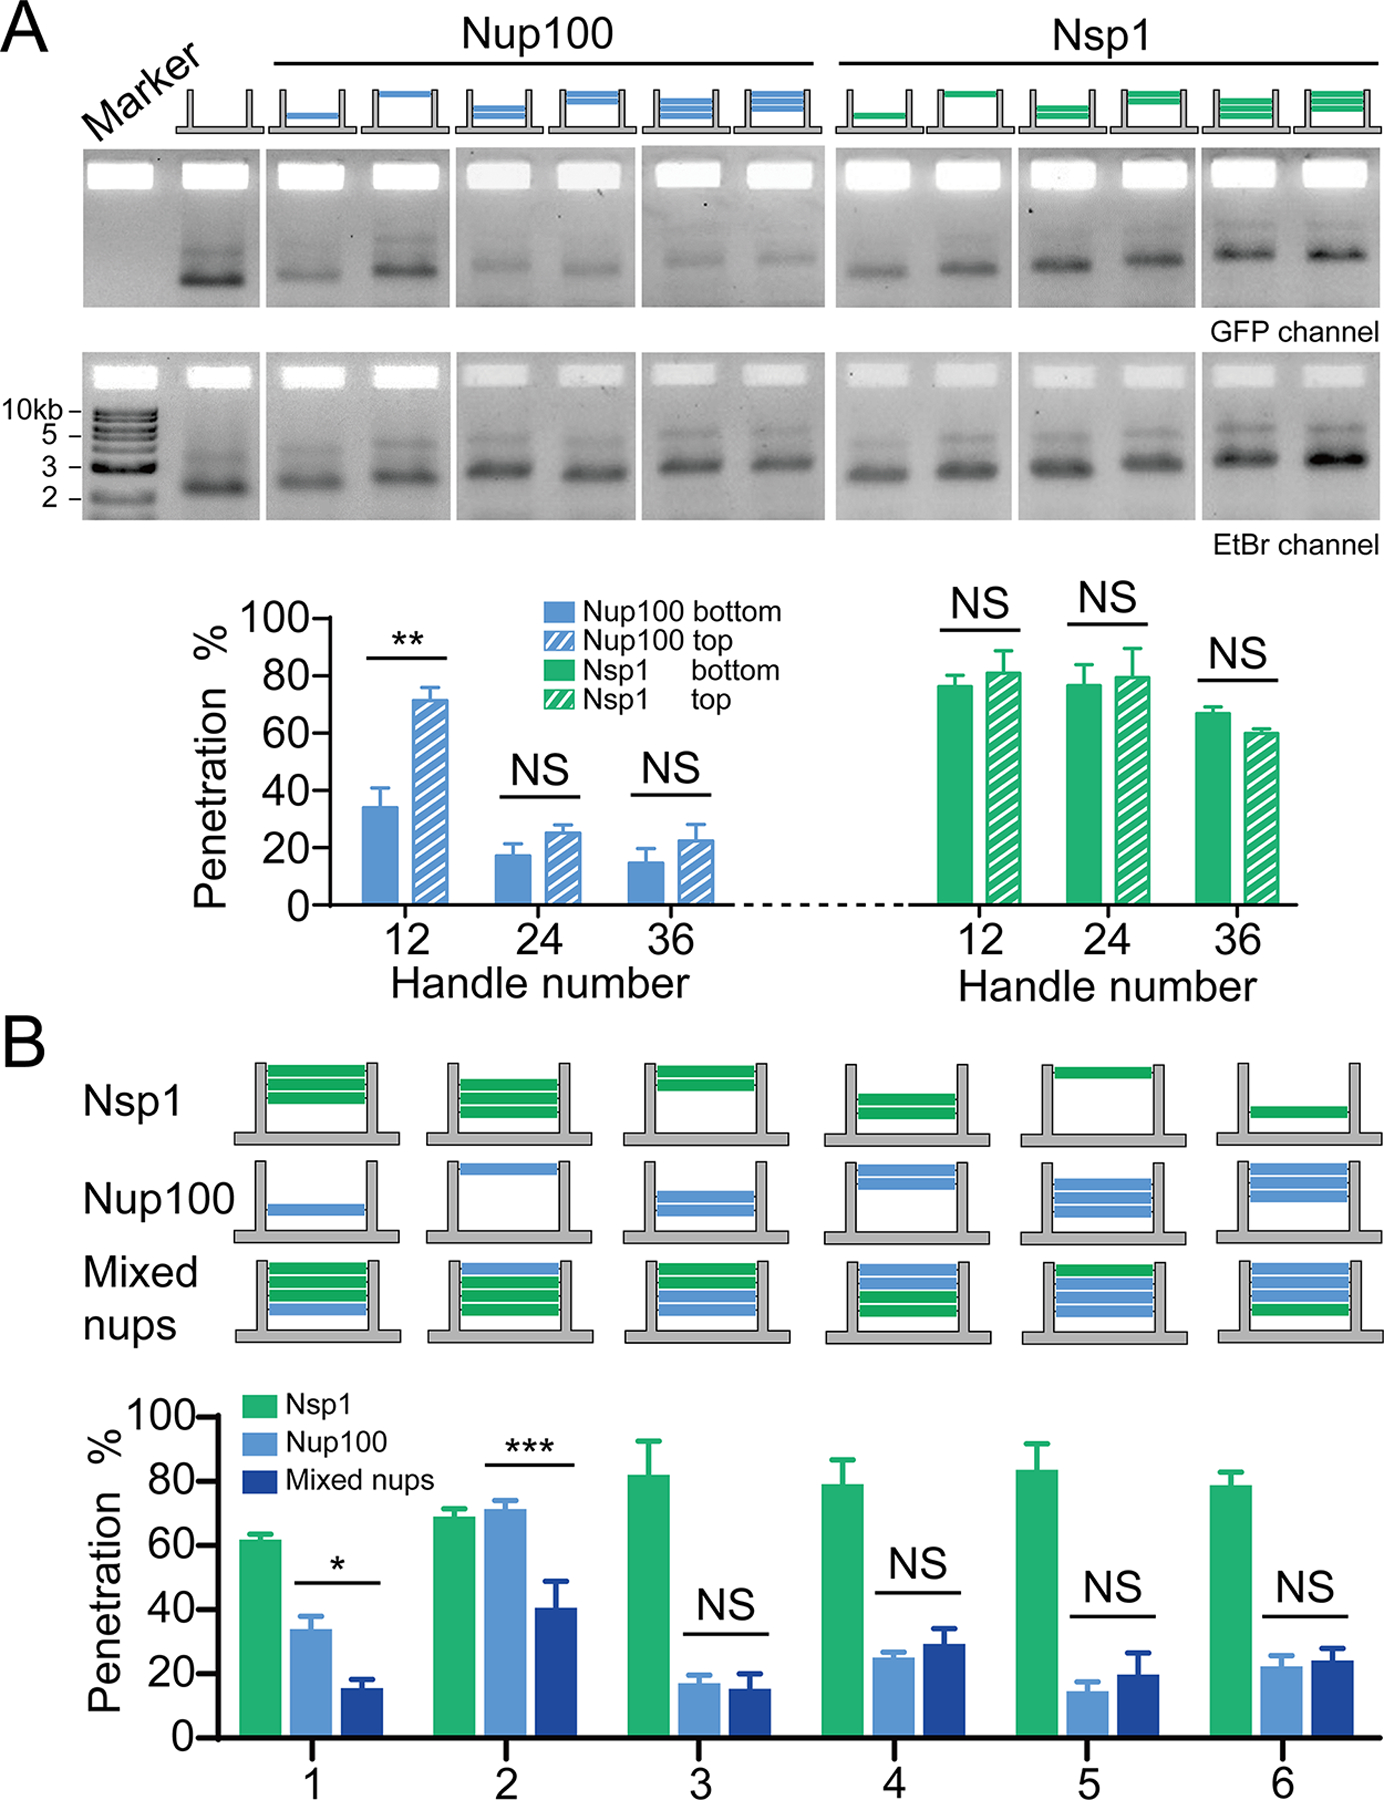
Figure 4.

Different nucleoporin arrangements affect barrier permeability. (A) Permeability of NanoTraps with the FG-nups located near the entrance (top) or the baseplate (bottom) of the NanoTrap, tested against the 53kDa GFP-SNAP-prey. The exact nup arrangement is shown by the schematic drawing at the top of each lane (blue: Nup100, green: Nsp1, 12 nups/layer). Statistical data are plotted to show mean ± SEM. Statistical significance was determined by a two-tailed Student’s t-test; n=3; NS: not significant (P≥0.05); **: P<0.01. (B) Permeability of NanoTraps containing single or mixed types of FG-nups, tested against the 53kDa GFP-SNAP-prey. The exact nup arrangements are shown by the schematic drawings at the top of each group of bars (blue: Nup100, green: Nsp1, 12 nups/layer). Data are plotted to show mean ± SEM. Difference between mixed-nup and Nup100-NanoTraps was analyzed by two-way ANOVA and Tukey’s multiple comparison; n=3; NS: not significant (P≥0.05); *: P<0.05; ***:P<0.001.
