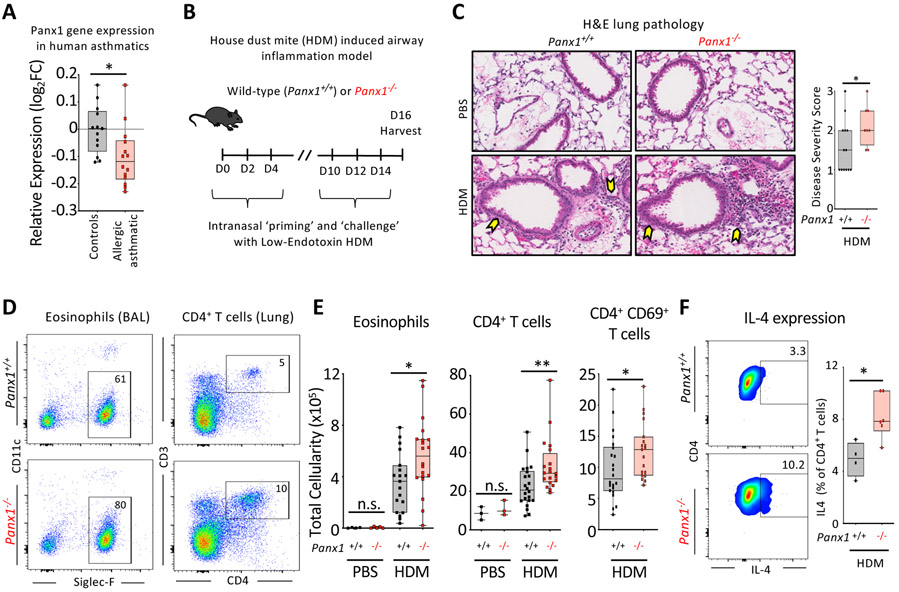
Figure 1. Panx1 expression restricts the severity of allergic airway inflammation.
(A) Relative Panx1 expression (log2FC relative to healthy) on peripheral blood mononuclear cells (PBMC) of healthy or allergic asthmatic children (ctrl n=13, a.asthmatics n=14) (*p=0.015), revealing a decrease in Panx1 in asthmatics.
(B) Schematic representation of house dust mite (HDM)-induced allergic airway inflammation.
(C) H&E lung histology images of wild-type (n=13) and global Panx1−/−(n=8) mice during PBS or HDM challenge. Arrows highlight areas of immune cell infiltration and inflammation. Disease severity score as assessed by a pathologist blinded to the genotypes (*p=0.05).
(D) Flow plots showing the extent of eosinophil and CD4+ T cell infiltration into the airways of Panx1+/+ and Panx1−/− mice after HDM-induced airway inflammation.
(E) Absolute cellularity of eosinophils (left) (*p=0.017), total CD4+ T cells (middle) (**p=0.008), and activated CD69+ CD4+ T cells (right) (*p=0.033). Each dot represents a mouse. (PBS control– Panx1+/+ n=4, PBS control– Panx1−/− n=5, HDM– Panx1+/+ n=19, HDM– Panx1−/− n=21) and lung (PBS– Panx1+/+ n=3, PBS– Panx1−/− n=3, HDM– Panx1+/+ n=22, HDM– Panx1−/− n=20), respectively, in wild-type (Panx1+/+) and global Panx1−/−.
(F) Flow plots showing the percentage of IL4+ CD4+ T cells (left) and quantification (right) during
HDM-induced allergic airway inflammation. (Panx1+/+ n=4, Panx1−/−n=6) (*p=0.011). Unpaired Student’s t-test (A,C,E,F). Related to Figure S1.

