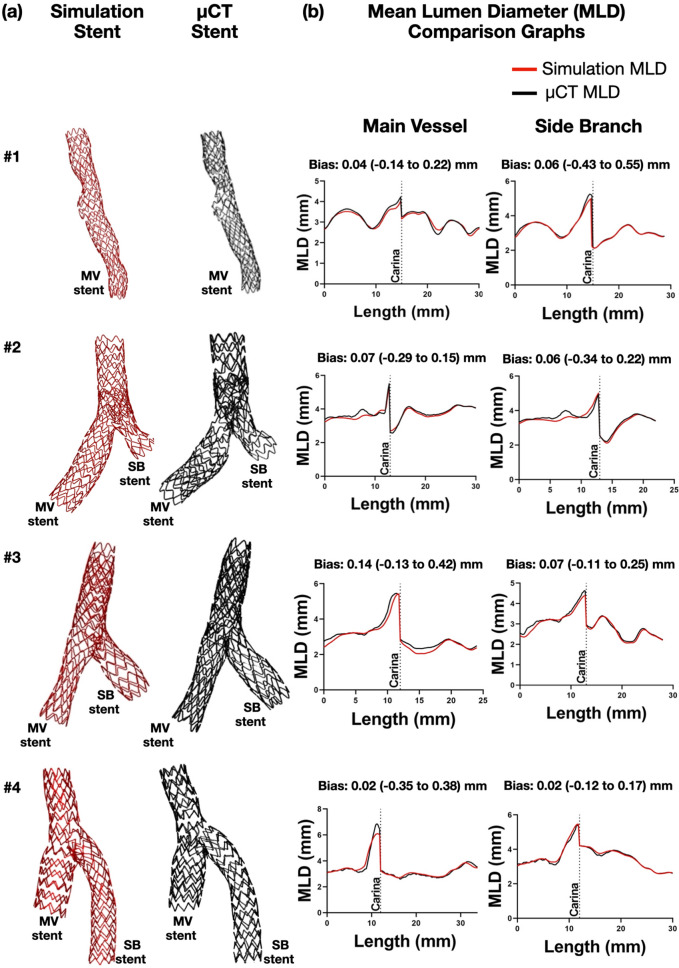
Figure 3.
Computational stenting simulation versus µCT (Bench cases). Qualitative (a) and morphometric (b) comparison of computational stenting simulations against bench stenting imaged by μCT. Graphs show the stented part of the lumen only. Bias refers to the average difference in mean lumen diameters (MLD; 95% limits of agreement) between methods by Bland–Altman analysis; MV main vessel, SB side branch, µCT micro-computed tomography.

