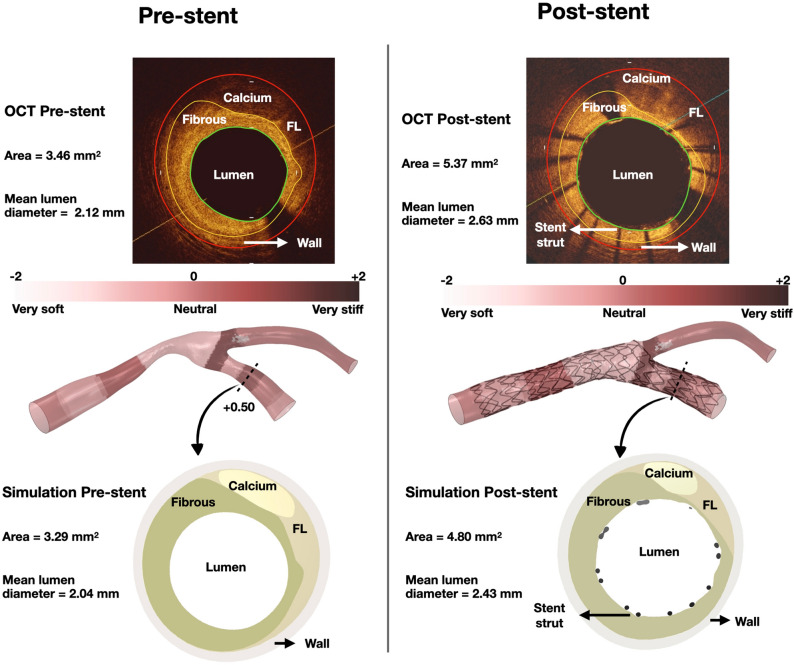
Figure 8.
Representative example showing the similarity between computational stenting simulation and reality (OCT). Left column shows the lumen size pre-stenting and right column shows the lumen size post-stenting. The figure illustrates the pre-procedural 3D reconstructed vessel anatomy and plaque stiffness, as well as the post-procedural stented vessel. Note the similarity in pre-stenting lumen size, shape and plaque constituents by OCT versus computational simulation. In the computational simulation, this vessel cross-section was assigned + 0.50 plaque stiffness based on OCT imaging. Likewise, note the similarity in post-stenting lumen size and shape, as well as stent size and circumferential configuration by OCT and computational simulation; FL fibrolipid.

