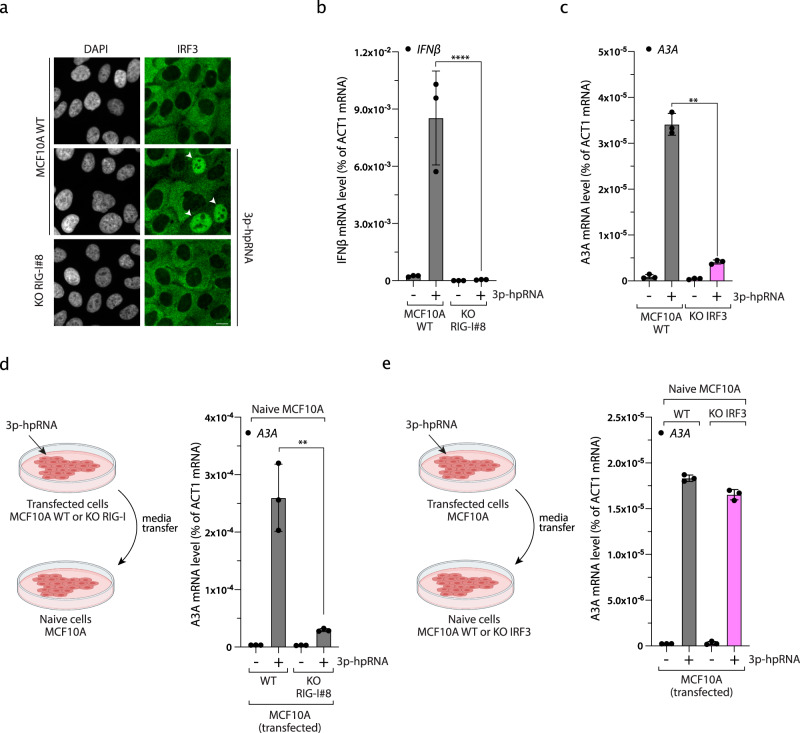
Fig. 2. IRF3-type I interferon axis controls APOBEC3A expression.
a IRF3 nuclear localization was monitored by immunofluorescence in MCF10A WT or RIG-I KO cells 16 h after 3p-hpRNA transfection (100 ng/mL). White arrows indicate nucleus positive for IRF3. Scale bar: 10 μm. b Quantification of IFNβ mRNA level by RT-qPCR in MCF10A WT cells and RIG-I KO cells transfected with 100 ng/mL of 3p-hpRNA for 16 h. Mean values ± SD (n = 3). ****P < 0.0001 (two-tailed Welch t-test). c The A3A mRNA level was monitored in the indicated cell lines transfected with 3p-hpRNA for 16 h. Mean values ± SD (n = 3). **P < 0.01 (two-tailed Welch t-test). d MCF10A WT or RIG-I KO cells were transfected with 3p-hpRNA (100 ng/mL) for 8 h followed by 16 h incubation in fresh media. Then, the conditioned media was collected, filtered, and then added to naive cells for 24 h before the quantification of A3A mRNA level by RT-qPCR. Mean values ± SD (n = 3). **P < 0.01 (two-tailed Welch t-test). e MCF10A cells were transfected with 3p-hpRNA for 8 h following by 16 h incubation in fresh media. Then, the conditioned media was collected, filtered, and then added to naive MCF10A WT or IRF3 KO cells for 24 h. The A3A mRNA levels were analyzed by RT-qPCR. Mean values ± SD (n = 3). Source data are provided as a Source Data file.

