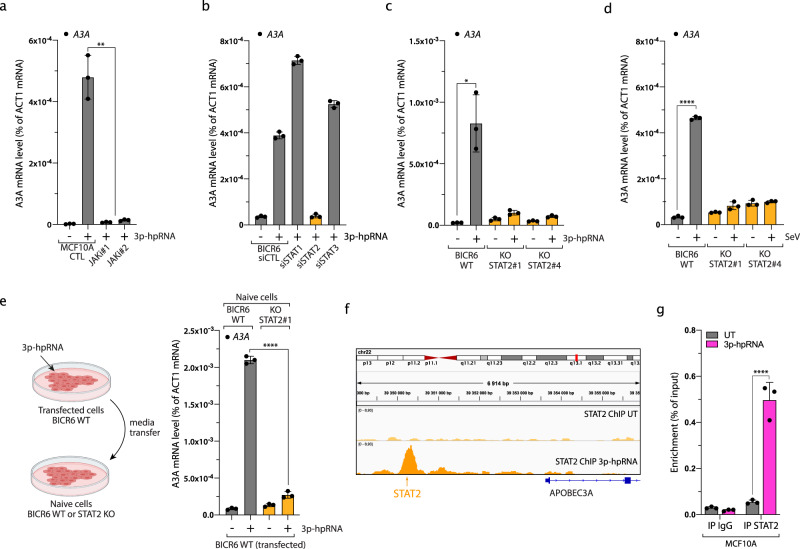
Fig. 3. Type I IFN signaling induces A3A expression through STAT2 after viral infection.
a The A3A mRNA level was monitored in MCF10A cells 16 h after treatment with 3p-hpRNA and JAK inhibitors (JAKi #1: 2 μM Pacritinib, JAKi #2: 2 μM Ruxolitinib). Mean values ± SD (n = 3). **P < 0.01 (two-tailed Welch t-test). b BICR6 cells were transfected with indicated siRNA for 36 h followed by 3p-hpRNA transfection (100 ng/mL) for 16 h. A3A expression level was determined by RT-qPCR. Mean values ± SD (n = 3). c 3p-hpRNA was transfected in BICR6 WT or STAT2 KO cells. The mRNA level of A3A was quantified by RT-qPCR 16 h after transfection. Mean values ± SD (n = 3). *P < 0.05 (two-tailed Welch t-test). d BICR6 WT and STAT2 KO cells were infected with SeV (1 MOI) for 24 h and the A3A mRNA level was quantified by RT-qPCR. Mean values ± SD (n = 3). ****P < 0.0001 (two-tailed Welch t-test). e BICR6 WT cells were transfected with 3p-hpRNA (400 ng/mL) for 8 h followed by 16 h incubation in fresh media. Then, naive BICR6 WT or STAT2 KO cells were incubated for 24 h in the conditioned media before the quantification of A3A mRNA level by RT-qPCR. Mean values ± SD (n = 3). ****P < 0.0001 (two-tailed Welch t-test). f STAT2 ChIP-sequencing in MCF10A cells untreated or treated for 16 h with 3p-hpRNA. Analysis of STAT2 ChIP-sequencing data focuses on the region upstream of the A3A TSS (transcription starting site). The arrow indicates the predicted STAT2-binding site. g STAT2 ChIP was performed in MCF10A cells transfected with 3p-hpRNA for 16 h. STAT2 binding at the A3A promoter was determined by qPCR. The results are representative of three independent experiments and qPCR was done in triplicate. Mean values ± SD. ****P < 0.0001 (two-tailed Welch t-test). Source data are provided as a Source Data file.

