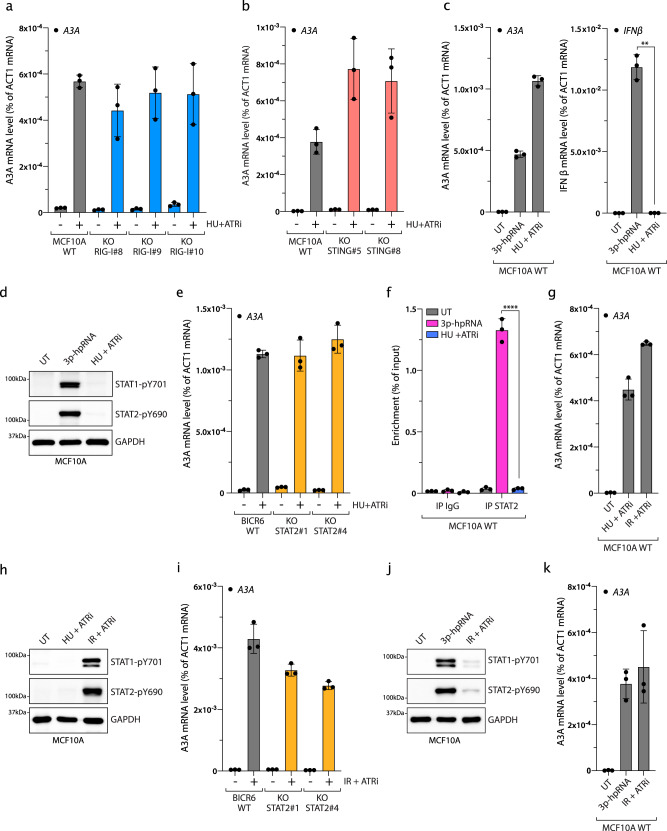
Fig. 5. IFN-independent expression of A3A following DNA damage.
a, b A3A expression was analyzed after 32 h of HU + ATRi treatment in MCF10A WT, RIG-I KO, and STING KO cells. Mean values ± SD (n = 3). c, d MCF10A cells were treated with 3p-hpRNA or HU + ATRi for 16 and 32 h, respectively. A3A and IFNβ mRNA levels were analyzed by RT-qPCR. Mean values ± SD (n = 3). **P < 0.01 (two-tailed Welch t-test) (c), and STAT1-pY701 and STAT2-pY690 levels were monitored by western blotting (d). e BICR6 WT or STAT2 KO cells were treated with HU + ATRi for 32 h and A3A expression level was determine by RT-qPCR. Mean values ± SD (n = 3). f STAT2 ChIP was performed in MCF10A cells transfected with 3p-hpRNA for 16 h or HU + ATRi for 32 h. STAT2 binding at A3A promoter was determined by qPCR. The results are representative of three independent experiments and qPCR was done in triplicate. Mean values ± SD. ****P < 0 0001 (two-tailed Welch t-test). g, h MCF10A cells were treated with HU + ATRi or IR + ATRi for 32 and 72 h, respectively. The A3A mRNA level was analyzed by RT-qPCR (mean values ± SD (n = 3)) (g), and STAT1-pY701 and STAT2-pY690 levels were monitored by western blotting (h). i, BICR6 WT or STAT2 KO cells were treated with IR + ATRi for 72 h and A3A expression was quantified by RT-qPCR. Mean values ± SD (n = 3). j, k MCF10A cells were treated with 3p-hpRNA or IR + ATRi for 16 and 72 h, respectively. STAT1pY701 and STAT2-pY690 levels were monitored by western blotting (j), and A3A levels were analyzed by RT-qPCR. Mean values ± SD (n = 3) (k). Source data are provided as a Source Data file.

