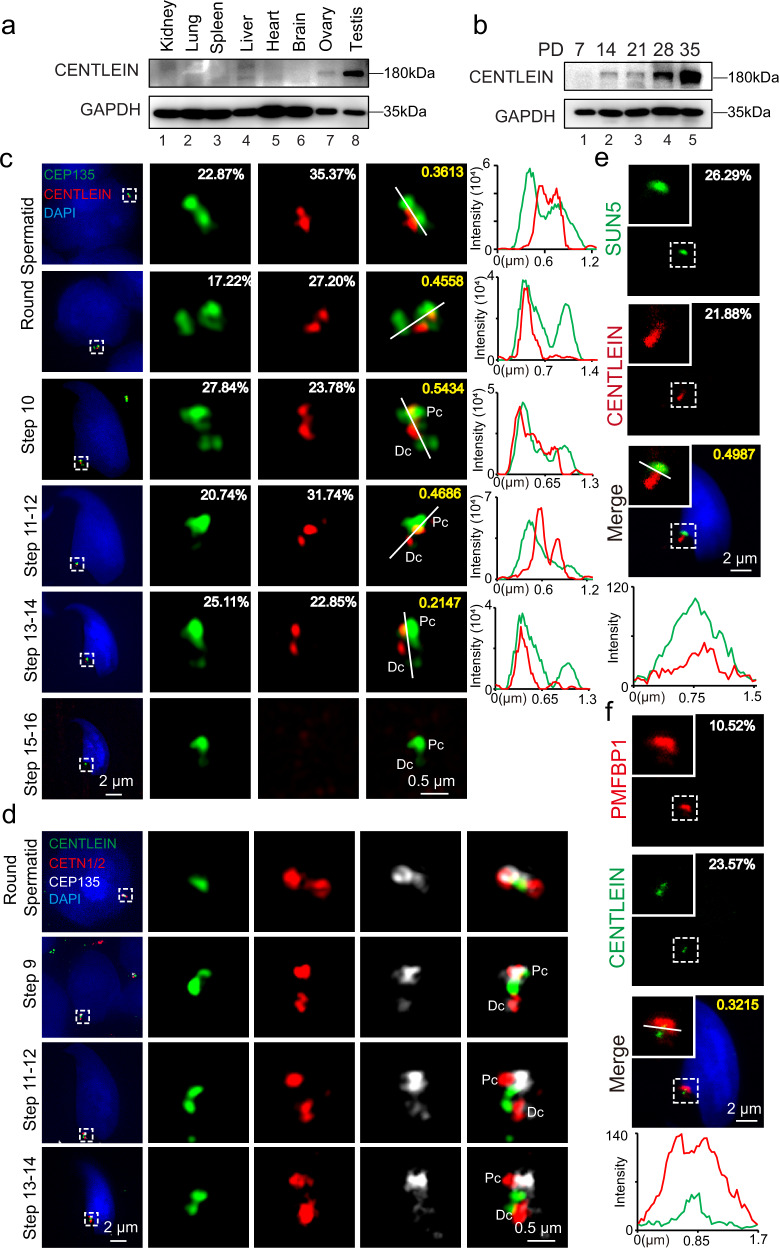
Fig. 5. CENTLEIN is localized at the sperm head–tail coupling apparatus.
a CENTLEIN was predominately expressed in the testis. Immunoblotting of CENTLEIN was performed in the kidney, lung, spleen, liver, heart, brain, ovary, and testis. GAPDH served as the loading control. b The onset of CENTLEIN expression in P14 testes. Immunoblotting of CENTLEIN was performed in the testis at different postnatal days. GAPDH served as the loading control. c The localization of CENTLEIN at different developmental stages. Super-resolution microscopic images of CENTLEIN (red) and CEP135 (green) in testicular germ cells. Nuclei were stained with DAPI (blue). The pixel overlaps of CENTLEIN and CEP135 were quantified using the IMARIS software. Pearson’s correlation coefficients were determined for the correlation of voxel intensity between CENTLEIN (red) and CEP135 (green) channels and are displayed in yellow. The Pearson’s coefficients are 0.3613, 0.4558, 0.5434, 0.4686, and 0.2147. Line-scan analysis (white lines) using the ZEN software (Right). Pc proximal centriole, Dc distal centriole. d Super-resolution microscopic images of CENTLEIN (green), CETN1/2 (red), and CEP135 (white) in testicular germ cells. Nuclei were stained with DAPI (blue). Pc proximal centriole, Dc distal centriole. e The immunofluorescence analysis CENTLEIN (red) and SUN5 (green) was performed in testicular germ cells. Nuclei were stained with DAPI (blue). The pixel overlaps of CENTLEIN and SUN5 were quantified using the IMARIS software. Pearson’s correlation coefficient was determined for the correlation of voxel intensity between CENTLEIN (red) and SUN5 (green) channels and are displayed in yellow. The Pearson’s coefficient is 0.4987. Line-scan analysis (white line) using the LAS X software (Lower). f The immunofluorescence analysis for CENTLEIN (green) and PMFBP1 (red) was performed in testicular germ cells. Nuclei were stained with DAPI (blue). The pixel overlaps of CENTLEIN and PFMBP1 were quantified using the IMARIS software. Pearson’s correlation coefficients were determined for the correlation of voxel intensity between CENTLEIN (green) and PMFBP1 (red) channels and are displayed in yellow. The Pearson’s coefficient is 0.3215. Line-scan analysis (white line) using the LAS X software (Lower). The experiment was repeated three times independently with similar results (a–f).

