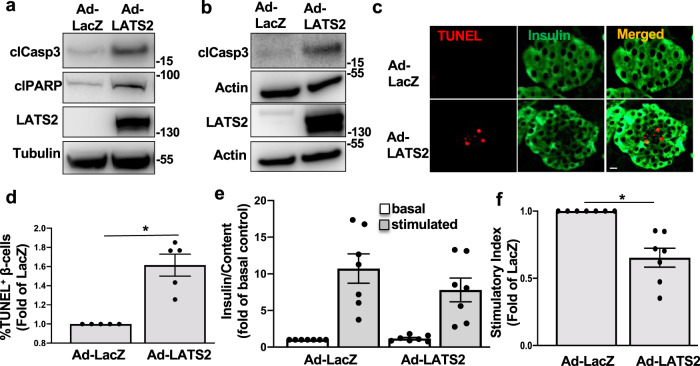
Fig. 2. LATS2 induces β-cell death and dysfunction.
INS-1E cells (a) and human islets (b–f) transduced with LacZ control or LATS2 adenoviruses for 48 h. a, b Representative western blots, c double staining for TUNEL (red) and insulin (green) and d pooled TUNEL analysis (c, d: n = 5 different human islets isolations). e Insulin secretion during 1 h incubation with 2.8 mM (basal) and 16.7 mM (stimulated) glucose, normalized to insulin content. f Insulin stimulatory index denotes the ratio of stimulated (16.7 mM glucoses) and basal (2.8 mM glucose) (e, f: n = 7 different human islets isolations). All western blots show representative results from at least three independent experiments. Data are expressed as means ± SEM. *p < 0.001; all by two-tailed Student’s t-tests. scale bar depicts 10 μm.

