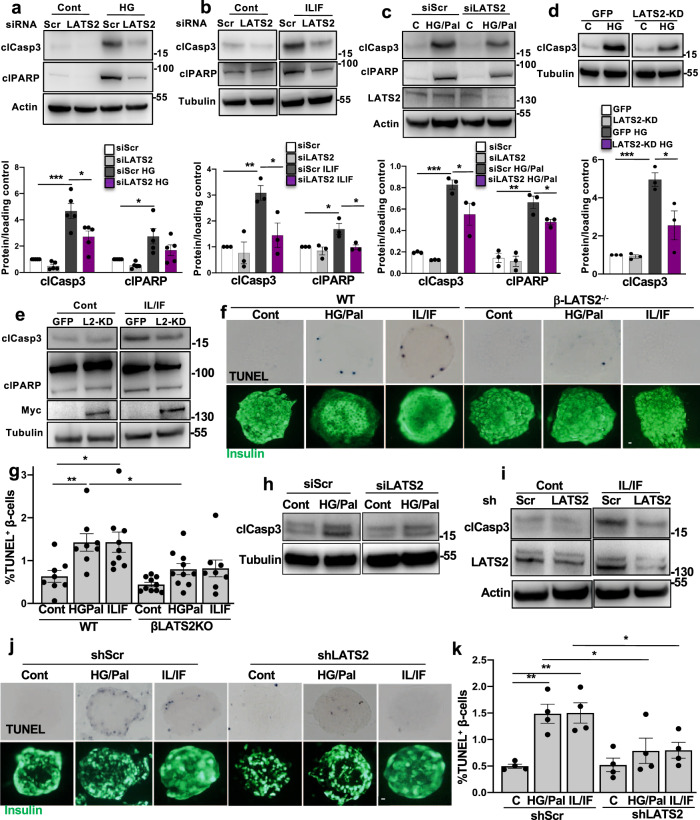
Fig. 3. Loss of the LATS2 improves β-cell survival in vitro.
a–c Representative western blots and pooled quantitative densitometry analysis (lower panels) of INS-1E cells transfected with LATS2 siRNA or control siScr and treated with a 22.2 mM glucose, b 2 ng/mL IL1β (IL) plus 1000 U/mL IFNγ (IF) and c 22.2 mM glucose plus 0.5 mM palmitate for 48 h (n = 5, 3 and 3 independent experiments, respectively for a–c). d, e Representative western blots and pooled quantitative densitometry analysis (lower panel) of INS-1E cells transfected with GFP or kinase-dead form of LATS2 (LATS2-KD) and then treated with d 22.2 mM glucose or e mixture of IL/IF for 48 h (n = 3 independent experiments). f, g Isolated islets from β-LATS2KO and Rip-Cre control mice were recovered after isolation overnight and exposed to diabetogenic conditions (IL-1β/IFNγ or the mixture of 22.2 mM glucose and 0.5 mM palmitate (HG/Pal)) for 72 h. β-cell apoptosis was analyzed by double staining of TUNEL (black nuclei), and insulin (green). Representative images (f) and quantitative percentage of TUNEL positive β-cells (g) are shown (n = 8, 8, 9, 10, 10, 8 mice, respectively for WT cont, WT HG/Pal, WT IL/IF, β-LATS2-KO cont, β-LATS2-KO HG/Pal, and β-LATS2-KO IL/IF conditions). h, i Representative western blots of human islets transfected with siLATS2 or transduced with Ad-hShLATS2 and treated with h 22.2 mM glucose plus 0.5 mM palmitate or i mixture of IL/IF for 72 h (n = 2 different human islets isolations). j, k Human islets transduced with Ad-hShLATS2 or Ad-shScr control were exposed to diabetogenic conditions (IL-1β/IFNγ or the mixture of 22.2 mM glucose and 0.5 mM palmitate (HG/Pal)) for 72 h. β-cell apoptosis was analyzed by double staining of TUNEL (black nuclei) and insulin (green). Representative images (j) and quantitative percentage of TUNEL positive β-cells (k) (n = 4 different human islets isolations) are shown. All lanes were run on the same gel but were noncontiguous (b, d, e, h, i). Data are expressed as means ± SEM. Pooled quantitative densitometry of western blots were normalized to the respective control conditions and ratios (except c), in which a normal distribution of results cannot be proven, were analyzed. *p < 0.05, **p < 0.01, ***p < 0.001; all by two-tailed Student’s t-tests. scale bar depicts 10 μm.

