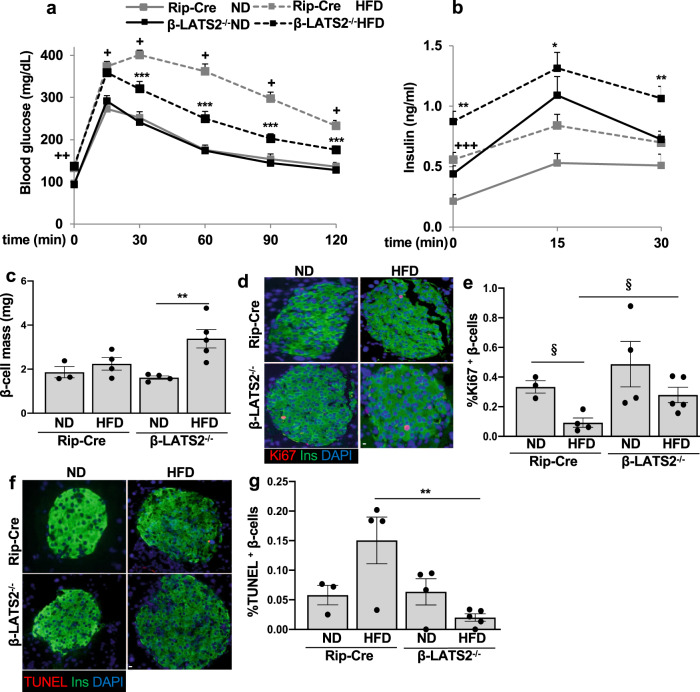
Fig. 6. β-cell specific LATS2 ablation protects from HFD induced diabetes in vivo.
a–g β-LATS2−/− and Rip-Cre control mice were fed a normal (ND) or high fat/ high sucrose diet (“Surwit”; HFD) for 17 weeks. a intraperitoneal glucose tolerance test (ipGTT) (Rip-Cre ND n = 8; Rip-Cre HFD n = 21; β-LATS2−/− ND n = 10; β-LATS2−/− HFD n = 19). b Insulin secretion during an ipGTT measured before (0 min), 15 and 30 min after glucose injection (Rip-Cre ND n = 7; Rip-Cre HFD n = 18; β-LATS2−/− ND n = 10; β-LATS2−/− HFD n = 15). c–g Mice were sacrificed at week 17. c β-cell mass given as percentage of the whole pancreatic section from 10 sections spanning the width of the pancreas (Rip-Cre ND n = 3; Rip-Cre HFD n = 4; β-LATS2−/− ND n = 4; β-LATS2−/− HFD n = 5). Representative images and quantitative analyses from triple staining for Ki67 (d, e) or TUNEL (f, g), insulin and DAPI expressed as percentage of TUNEL- or Ki67-positive β-cells (Rip-Cre ND n = 3; Rip-Cre HFD n = 4; β-LATS2−/− ND n = 4; β-LATS2−/− HFD n = 5). Data are expressed as means ± SEM. +p < 0.001 RIP-Cre-HFD to RIP-Cre ND mice. ++p < 0.01 RIP-Cre-HFD to RIP-Cre ND mice. +++p < 0.05 RIP-Cre-HFD to RIP-Cre ND mice. *p < 0.05 β-LATS2−/−-HFD compared to RIP-Cre-HFD mice. **p < 0.01 β-LATS2−/−-HFD compared to RIP-Cre-HFD mice. ***p < 0.001 β-LATS2−/−-HFD compared to RIP-Cre-HFD mice. §p < 0.05. All by one-way ANOVA with Tukey’s post hoc test except “e” by two-tailed Student’s t-tests. Scale bar depicts 10 μm.

