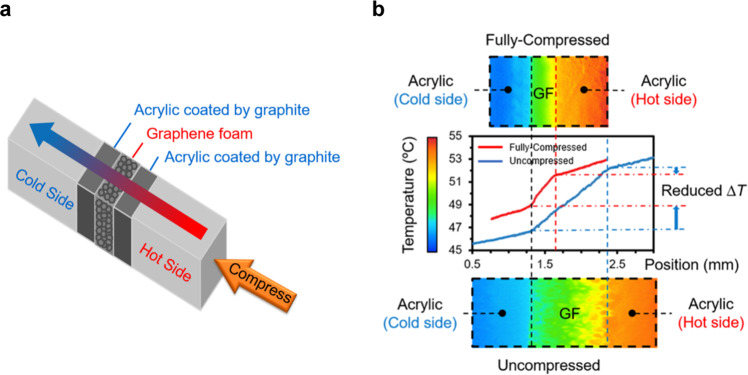
Fig. 7. Thermal property characterization and uncertainty quantification.
a Schematic of sample stack illustrating the direction of heat flow and compression. b 2-D temperature maps for the fully uncompressed (bottom) and fully compressed (top) states and the corresponding 1-D temperature profiles. The reduced temperature difference across the sample indicates an increase of thermal conductance after compression. As illustrated in the 1-D profiles (i.e., the lack of a temperature jump at the interfaces), the interfacial resistance between the sample and the reference layers is negligible compared to the thermal resistance of the sample itself.

