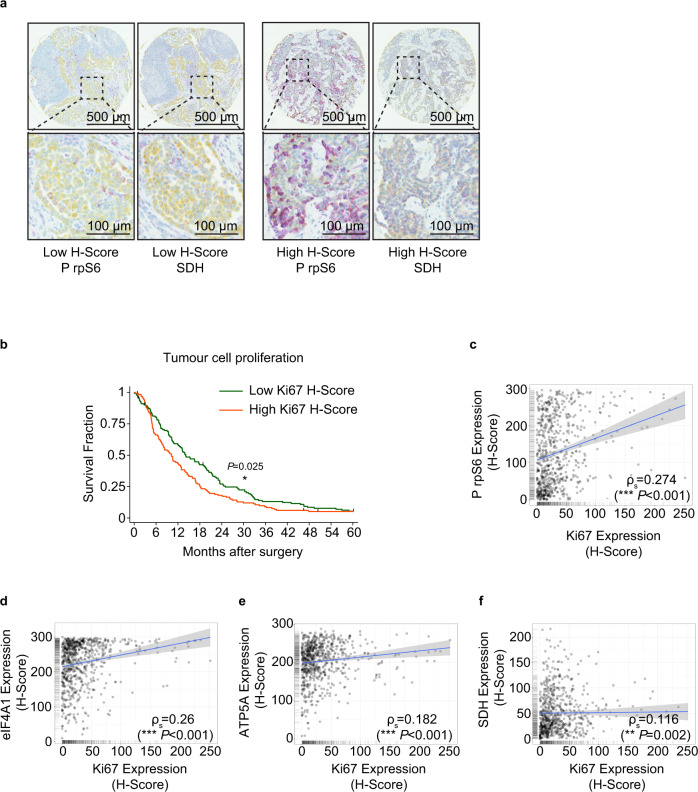
Fig. 2. Protein synthesis and mitochondrial protein expression correlate with poor survival in patient-derived material.
a Representative section of tissue microarray (TMA) probed with antibodies against phospho-Ser240/244 rpS6 (magenta) and SDH (magenta). Tumour areas within the TMA cores were identified by cytokeratin staining (yellow). Visiopharm® software was used to quantify the magenta staining in the tumour area. b Kaplan–Meier plot, showing Ki67 staining is a strong predictor of survival. The 272 patients included in the TMAs, were split into two equally sized groups according to Ki67 H-score. A log-rank test was performed to determine the significance of differences in survival (*p = 0.025). c Scatter plot of the H-scores of rpS6 phosphorylation (mTOR activity) and Ki67 expression in mesothelioma TMAs. Linear regression analysis was performed by Spearman’s rank correlation, the coefficient was 0.274. The linear regression fit is depicted with a blue line. The grey band shown is the 95% confidence interval. d Scatter plot of the H-scores of eIF4A1 expression and Ki67 expression in mesothelioma TMAs. Linear regression analysis was performed by Spearman’s rank correlation, the coefficient was 0.26. The linear regression fit is depicted with a blue line. The grey band shown is the 95% confidence interval. e Scatter plot of the H-scores of mitochondrial ATP5A expression and Ki67 expression in mesothelioma TMAs. Linear regression analysis was performed by Spearman’s rank correlation, the coefficient was 0.182. The linear regression fit is depicted with a blue line. The grey band shown is the 95% confidence interval. f Scatter plot of the H-scores of mitochondrial SDH expression and Ki67 expression in mesothelioma TMAs. Linear regression analysis was performed by Spearman’s rank correlation, the coefficient was 0.116. The linear regression fit is depicted with a blue line. The grey band shown is the 95% confidence interval.

