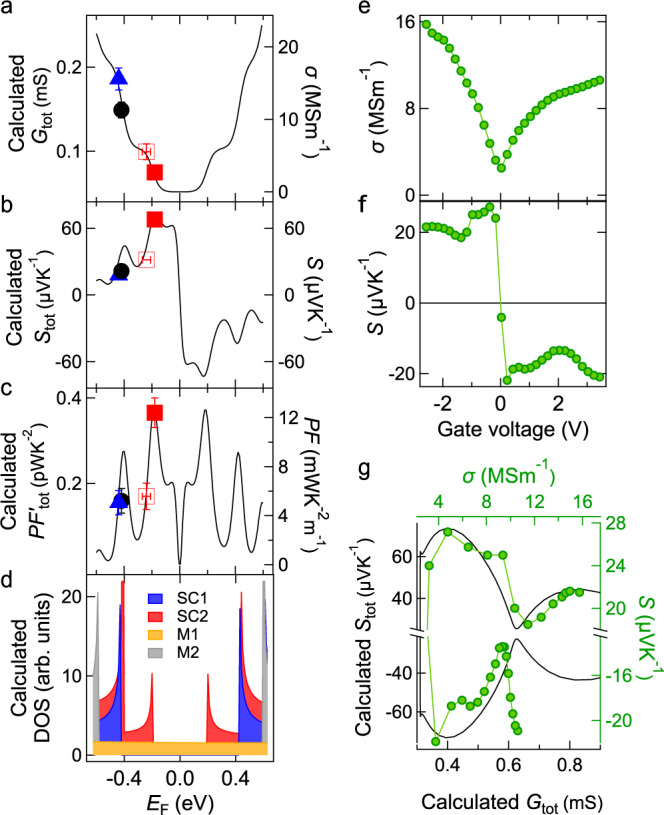
Fig. 2. Explaining the EF-dependent thermoelectric (TE) properties of carbon nanotube (CNT) fibers through modeling.

a Calculated electrical conductance Gtot, b Seebeck coefficient Stot, and c power factor (left) versus Fermi energy EF. Experimental data from four chemically treated samples are shown by different symbols on the right axis as a function of the estimated Fermi energy: iodine monochloride (ICl) doped (solid blue triangle), as-produced (solid black circle), annealed at 350 °C (open red square), and annealed at 500 °C (solid red square). Error bars indicate SD. d The density of states (DOS) of four representative SWCNTs contained in our CNT fibers, an inner-wall semiconducting SWCNT (SC1, blue), an inner-wall metallic SWCNT (M1, orange), an outer-wall semiconducting SWCNT (SC2, red), and an outer-wall metallic SWCNT (M2, gray). e, f TE properties tuned by the electrolyte gating technique. e, Measured electrical conductivity σ and f S as a function of gate voltage. g Comparison of calculated Stot (left) as a function of Gtot (bottom) with experimental S (right) as a function of σ (top) with an offset in the x axis such that the examined range by the experiments agrees. The calculated Stot is plotted with a black line, and the experimental data for gated samples are shown by a green line with solid circles.
