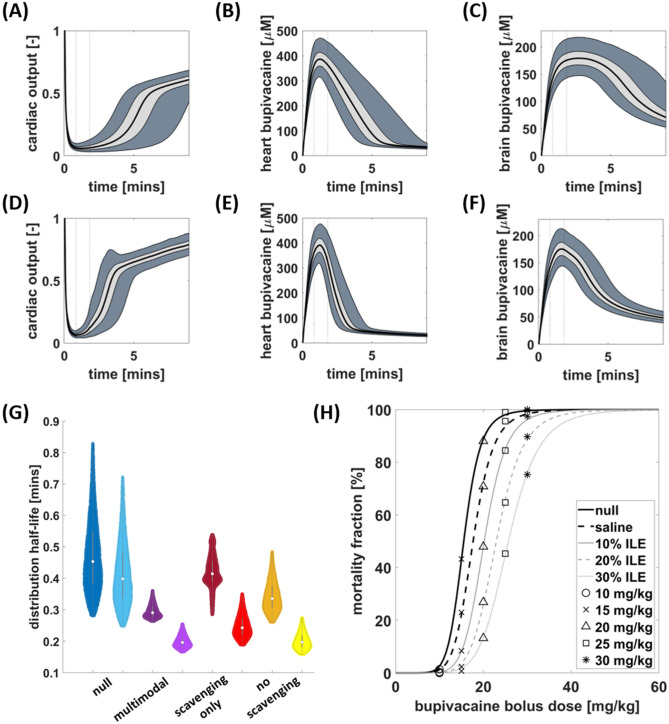
Fig. 3.
A–F Predicted time courses for cardiac output and bupivacaine content of vital organs. Each plot represents outcomes for a virtual population of 10,000 rats. Top row: spontaneous recovery (no fluid intervention). Bottom row: recovery following treatment with a 60 s bolus of 30% ILE at 4 mL/kg. A, D Recovery of cardiac output. B, E Bupivacaine in the heart. C, F Bupivacaine in the brain. Dark regions: 95% intervals. Light regions: 50% intervals. Solid black line: median. Vertical dashed lines indicate beginning and end of lipid administration. G Distribution half-lives quantified across the virtual population. Figure displays population distributions pairwise for total plasma (left-hand, darker violin plot) and unbound bupivacaine in plasma (right-hand, lighter violin plot). H Mortality curves for simulated resuscitation scenarios following bupivacaine bolus doses of 10, 15, 20 and 25 mg/kg. Each marker summarizes the predicted mortality outcomes for a virtual population of 10,000 rats. Lines indicate the sigmoid dose–response curves used to estimate the median lethal dose. ILE intravenous lipid emulsion

