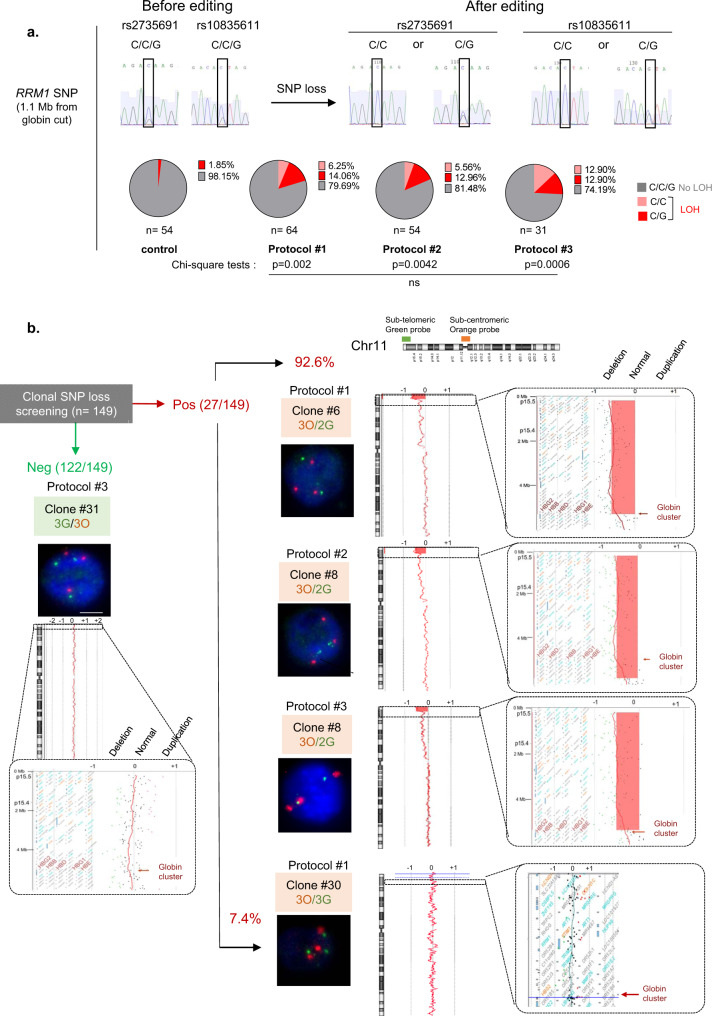
Fig. 2. Confirmation and mapping of Chr11p terminal deletions.
aRRM1/SNP sequencing after subclonal analysis of HEK293T at D4. C/C/G genotype in RRM1 (in gray) on two SNP positions for NT cells. After editing, clones presented SNP-LOH with C/C (in pink) or C/G genotype (in red). Frequencies of SNP losses are indicated in pie chart for each protocol. LOH frequencies with protocols 1–3 were compared to non-transduced cells by two-sided Chi-square tests. Indels frequency was 63, 83 56% for protocols 1–3, respectively, n correspond to analyzed cells from each polyclonal pool (1 per protocol). b Chromosome analysis in HEK293T clones depending on SNP screening. Left, DNA-FISH (Scale-bar: 5 µm) and array-CGH of one LOH-negative clone. Right, DNA-FISH and array-CGH of LOH-positive clones from protocols #1–3. Deleted area is in red. n correspond to analyzed SNP loss cells (from protocols #1–3). Source data are provided as a Source Data file.

