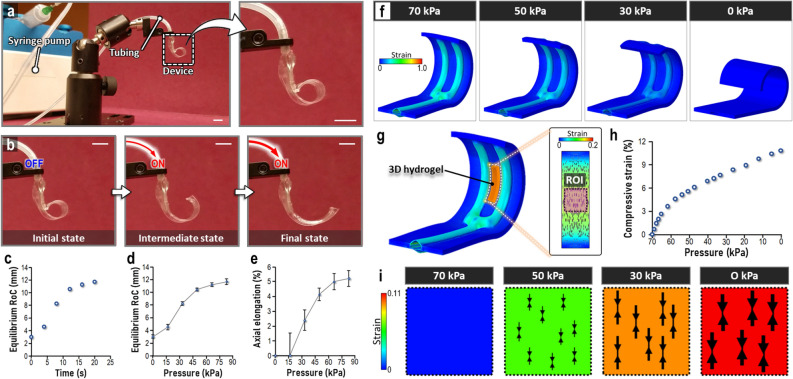
Figure 2.
Pneumatic actuation of soft robotic constrictor. (a) Experimental setup for controlled pneumatical actuation of the soft robotic device. Scale bars, 5 mm. (b) Photographs of the uncoiling device due to applied air pressure. Scale bars, 5 mm. (c) Quantification of equilibrium RoC during the application of pneumatic pressure. Plots of equilibrium RoC (d) and axial elongation (e) at different levels of applied pneumatic pressure. (f) Finite element analysis-based computation prediction of substrate geometry and strain during pneumatic actuation of the soft robot. The heatmap shows maximum nominal principal strain. (g) Inclusion of 3D hydrogel for finite element modeling of 3D tissue. (h,i) In silico prediction of changes in mean compressive strain in the ROI with decreasing pneumatic pressure. The size of arrow pairs in (i is proportional to the level of compressive strain. The heatmap shows maximum nominal principal compressive strain. Data show mean ± SD with n = 3.

