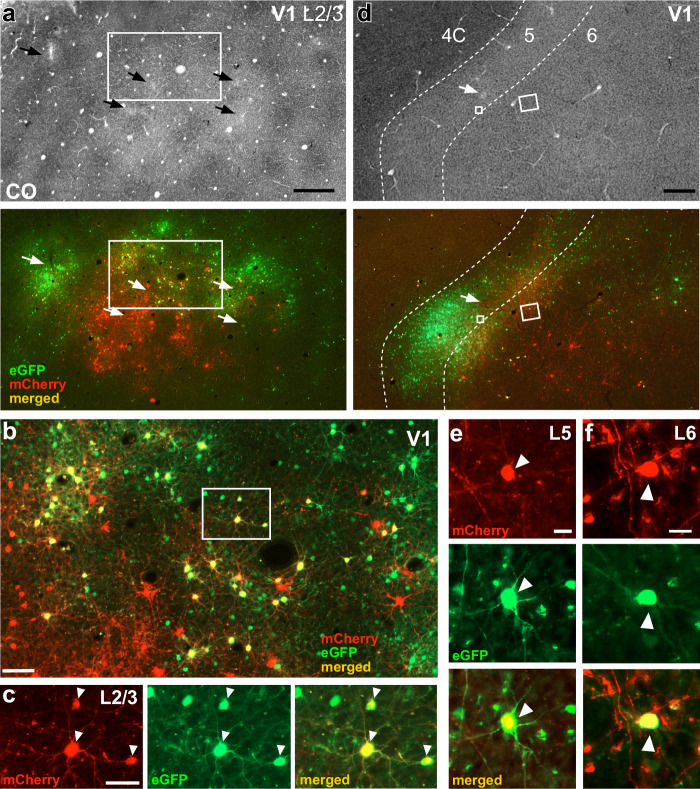
Fig. 2. V1 injection sites.
a Case MK405. Image of a single tangential section through V1 L2/3 stained for CO (Top) after being imaged for mCherry and GFP fluorescence (Bottom). The merged channel shows double-labeled (yellow) “starter” V1→V2 cells. Arrows point to the V1 injection sites in both sections. The region inside the white box is shown at higher magnification in panel (b). Scale bar: 500 µm. b Higher magnification of the V1 region inside the box in panel (a). Red cells: V1→V2 neurons co-infected with CAV2 and AAV9-TVAmCherry, but not with RVdG. Yellow cells: starter V1→V2 cells double-labeled due to triple infection with CAV2-Cre, AAV9-TVAmCherry, and RVdG-GFP. Of these double-labeled cells only those that were additionally infected by AAV9-oG act as “starter” cells. Green cells: cells sending monosynaptic input to the starter V1→V2 cells (but some local V1 green label is due to TVA “leak”—see Results and Supplementary Fig. 2). Scale bar: 100 µm. Cells in the boxed region are shown at higher magnification in panel (c). c Higher magnification of 3 double-labeled V1→V2 cells (arrowheads) shown under mCherry (Left) or GFP fluorescence (Middle), and merged (Right). Scale bar: 50 µm. d Image of a single tangential section through V1 L4C-6 stained for CO (Top) and imaged for fluorescent signals (Bottom) in the same case as in (a–c). Yellow cells inside the small and large white boxes are shown at higher magnification in panels (e) and (f), respectively. Dashed contours delineate layer boundaries, and layers are indicated at the top. Scale bar: 500 µm. e, f V1→V2 starter cells (arrowheads) in L5 (e) and L6 (f), shown under mCherry (Top) or GFP (Middle) fluorescence, and merged (Bottom). Scale bars: 20 µm. Results in (a–f) are representative of injection sites made in three independent cases with similar results.

