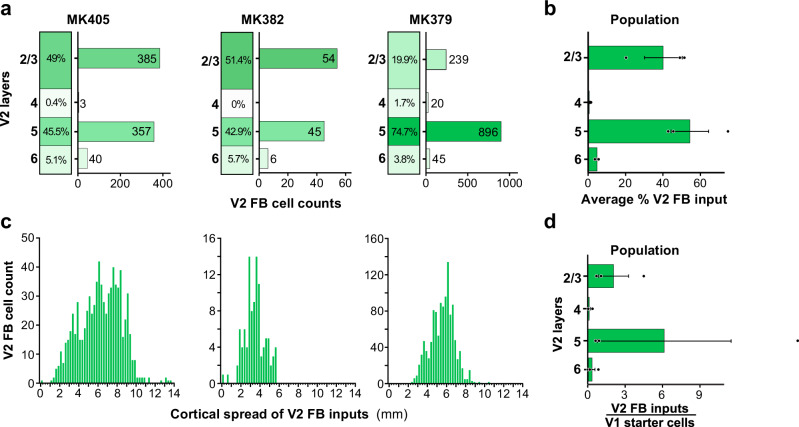
Fig. 5. Laminar and tangential distribution of monosynaptic V2 FB inputs to V1→V2 cells.
a Percent and number of GFP-labeled cells across V2 layers for each of the three cases. b Population average percent ± s.e.m. of GFP-labeled cells across V2 layers (n = 2090 cells in three independent animals). c Distribution of GFP-labeled cells across the tangential domain of V2 pooled across layers. Other conventions as in Fig. 4. d Population average ratio of V2 input cells in each layer to the total number of V1→V2 starter cells (pooled across layers; n = 3 independent animals). Error bars: s.e.m.

