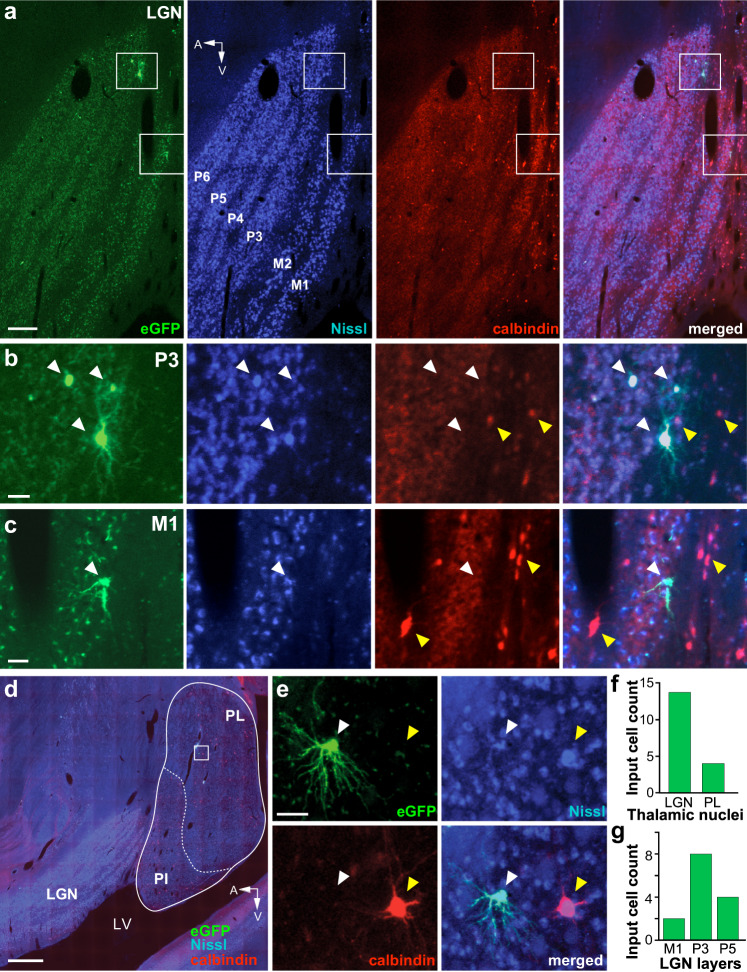
Fig. 8. Thalamic input cells.
a Case MK379. Image of a single parasagittal section through the LGN viewed under GFP fluorescence (Left), stained for fluorescent Nissl (Middle Left), immunostained for Calbindin-Alexa647 (Middle Right), and with all three channels merged (Right). The GFP-labeled cells inside the top and bottom white boxes are shown at higher magnification in (b, c), respectively. The parvocellular (P3–6) and magnocellular (M1–2) LGN layers are labeled. A: anterior; V: ventral. Scale bar: 250 µm. b, c GFP-labeled LGN input cells in the P3 (b) and M1 (c) layers are shown in the same three channels as the top panels and with all channels merged (Right). White arrowheads point to the location of GFP-labeled neurons, yellow arrowheads point to calbindin-positive cells. The GFP-labeled cells are not calbindin-positive. Scale bars: 50 µm. d Image of a sagittal section through the LGN and pulvinar, with all three fluorescent channels (GFP, calbindin, and Nissl) merged. The cells inside the white box are shown at higher magnification in (e). PL lateral pulvinar, PI inferior pulvinar, LV lateral ventricle. Scale bar: 1 mm. e A GFP-labeled input cell (white arrowhead) in the PL imaged under the same three channels as for the LGN cells and with all channels merged (Bottom Right). A yellow arrowhead in each panel points to the location of a calbindin-positive cell (red). The GFP-labeled cell is not calbindin-positive. Scale bar: 50 µm. f Number of GFP-labeled cells in the thalamic nuclei. g Number of GFP-labeled cells in the LGN layers.

