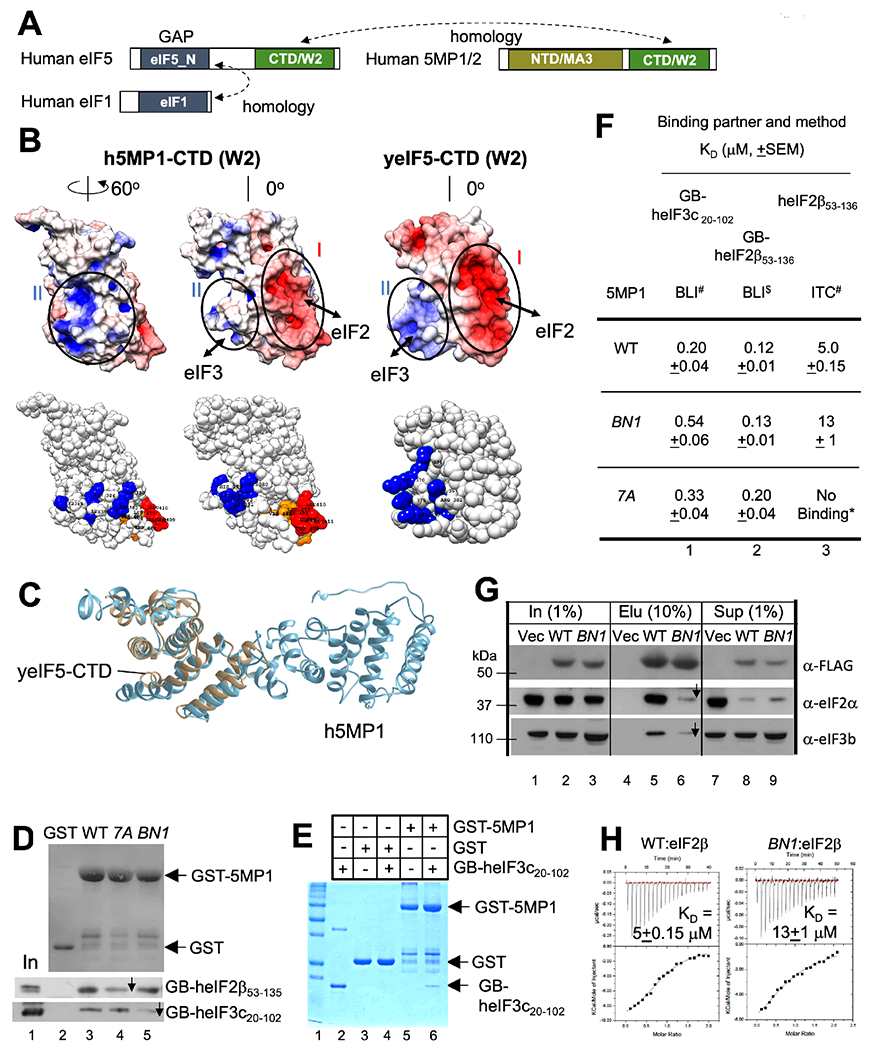
Fig. 1. 5MP1 carries basic and acidic surfaces responsible for binding eIF3 and eIF2.

(A) Homology between eIF1, eIF5 and 5MP. Boxes indicate primary structure with domains defined by Pfam in distinct colors. (B) Yeast (y) eIF5 and human (h) 5MP1 mutations used in this study. Top, surface charge presentation of h5MP1-CTD (homology model, left and middle) and yeIF5-CTD (crystal structure, right) (Wei et al., 2006). h5MP1, middle, is viewed from the same angle as yeIF5. h5MP1, right, is viewed after 60° rotation. Red and blue indicate the areas of negative and positive charges, respectively. Bottom, spherical presentations indicating the location of amino acids altered by BN1 (K380Q K383Q H386Q K389Q K391Q for h5MP1-BN1) in blue and by 7A (F401A V402A W404A L405A EEE409-411AAA for h5MP1-7A) in red (glutamate) or orange (hydrophobic residues). The 5MP1 homology model was generated with I-TASSER. (C) Homology model of 5MP1 (blue) superimposed with crystal structure of yeIF5-CTD (gray) (PBD ID: 2FUL) (Wei et al., 2006). (D) and (E) GST pull down assays. 10 μg GST-h5MP1, GST-h5MP1-BN1, or ~5 μg GST as control, was incubated with (D) GB-heIF2β53-136 or GB-heIF3c20-102 expressed in E. coli or (E) purified GB-heIF3c20-102 (20 μg), precipitated with glutathione resin and analyzed by SDS-PAGE along with input (2.5% in lane 1, panel D; 10% in lane 2, panel E). (D) top, Ponceau staining; bottom two gels, immunoblot with anti-His antibodies. (E), Coomassie Blue staining. (F) Effect of 5MP1 surface mutations on interactions in vitro. KD values obtained with BLI or ITC is tabulated for 5MP1 (WT or its BN1 or 7A mutant) interaction with binding partners listed across the top. *No binding detected (Fig. S1F). See also Fig. S1D–E and S2A. # n=4; $ n=3. (G) Immunoblot analyses of FLAG-h5MP1 complexes affinity-purified from HEK293T transfected with expression plasmids (Key Resource Table). 10% of WT (lane 5) and BN1 mutant (lane 6) 5MP1 complexes or mock purified fraction from the empty vector transfectant (lane 4) were analyzed along with 1% input amount (lanes 1-3) and 1 % supernatant fractions (lanes 7-9). Antibodies used for detection of the human antigen are indicated to the right (Santa Cruz Biotechnology) (Kozel et al., 2016). (H) ITC experiments. The top panels represent the raw data from ITC titrations. Bottom panels show the non-linear least square fit of the integrated heats as function of molar ratio of titration of heIF2β53-136 (200 μM) with (top) h5MP1 (WT) or (bottom) 5MP1-BN1 at 20 μM with the estimated KD shown inside (n=4). *p=0.008, compared to WT.
