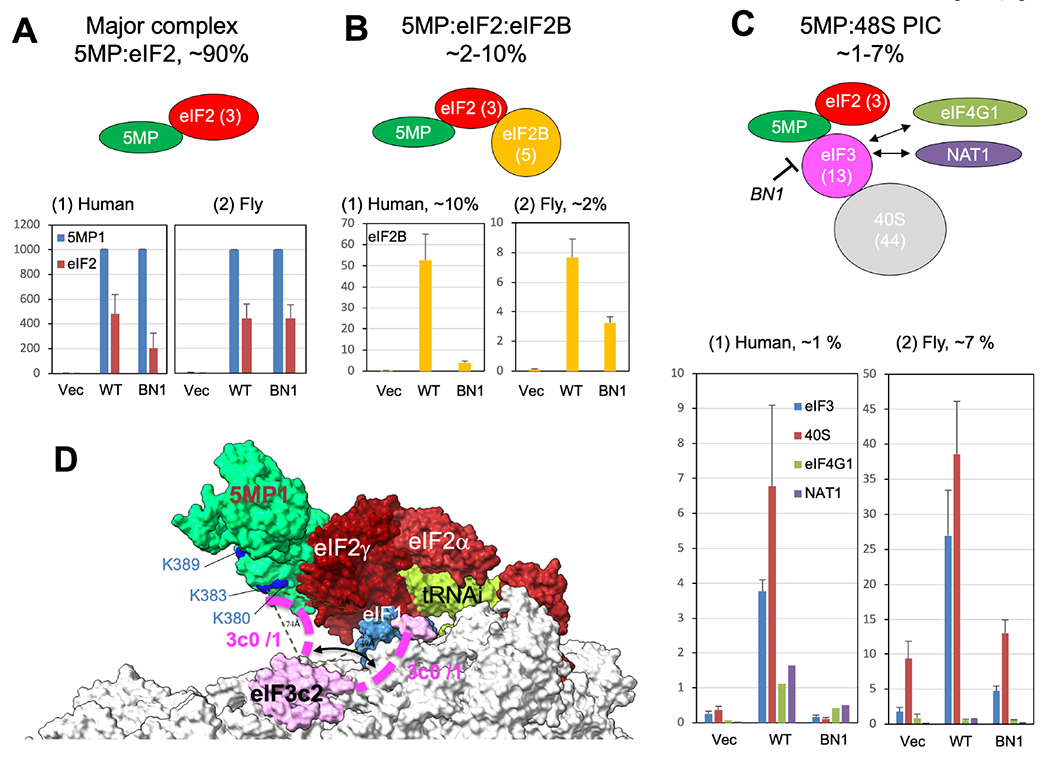
Fig. 4. MS analysis of 5MP-eIF complexes shows that 5MP is recruited to the PIC through eIF3c in humans and flies.

(A)-(C) 5MP-eIF complexes were purified from HEK293T (panel 1) or fly S2 cells (panel 2) and subjected for whole-lane MS analysis, as described previously (Kozel et al., 2016) (also see Supplementary Text and Fig. S3A). Graphs show emPAI values in y axis, a proxy for relative molecular amounts of proteins detected (Ishihama et al., 2005), obtained from the whole lane of the mock-treated sample (Vec), WT FL-5MP1 complex (WT) and FL-5MP1-BN1 complex (BN1), averaged for all the experiments and subunits (except human experiment 2 for C, panel 1). Data from co-purified components were presented based on their membership in the following complexes, 5MP1-eIF2 (panel 1), 5MP1-eIF2-eIF2B (panel 2) and 5MP1-PIC (panel 3). Their relative ratios in the panel title were measured by % compared to average emPAI values of eIF2 in WT. Bars indicate SEM. (D) A 5MP1-PIC docking model. A view from the mRNA-exit side is presented to describe the location of 5MP1 (green) relative to the locations of 3c2 segment of eIF3c (pink) and eIF1 (blue). The lysine residues mutated by BN1 are highlighted in blue and labeled if visible. Purple dotted line, possible alternative locations of 3c0/1 segment of eIF3c. See supplemental text for generation of the docking model.
