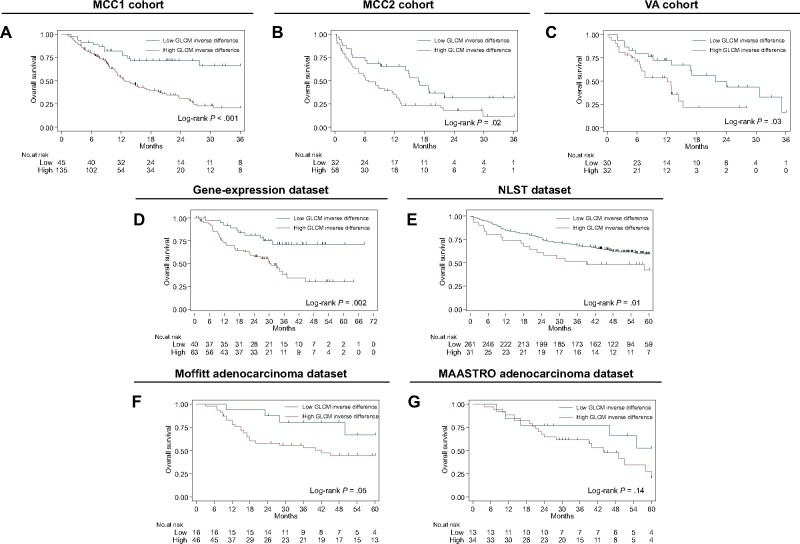
Figure 5.
Kaplan-Meier survival curves (overall survival) for the dichotomized radiomics feature (gray level co-occurrence matrix [GLCM] inverse difference). The same dichotomized cut-point found in the MCC1 training cohort was used for the survival analyses (A-C) in the training and 2 validation cohorts, respectively, and (D-G) the 4 prognostic datasets (ie, gene-expression dataset, National Lung Screening Trial (NLST) dataset, Moffitt adenocarcinoma dataset, and Maastricht Radiation Oncology Clinic (MAASTRO) adenocarcinoma dataset, respectively). The log-rank test was used to calculate 2-sided P values.

