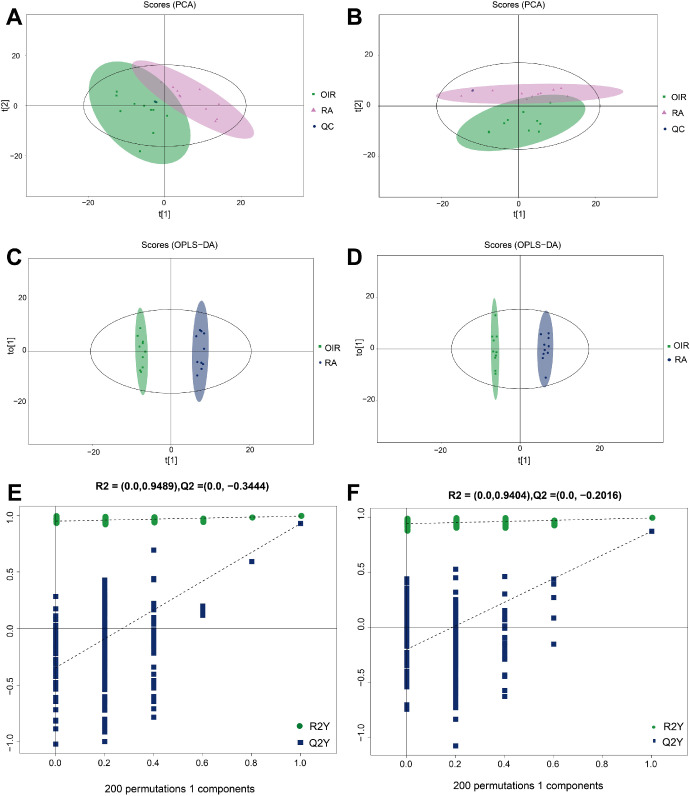
Figure 2.
Qualification evaluation of untargeted metabolomics analysis. PCA analysis of the included samples in both groups under the cationic (A) and anionic mode (B). OPLS-DA score plot of OIR group and control group under the cationic (C) and anionic mode (D). Permutation analysis plot of the OPLS-DA model, under the cationic (E) and anionic mode (F).

