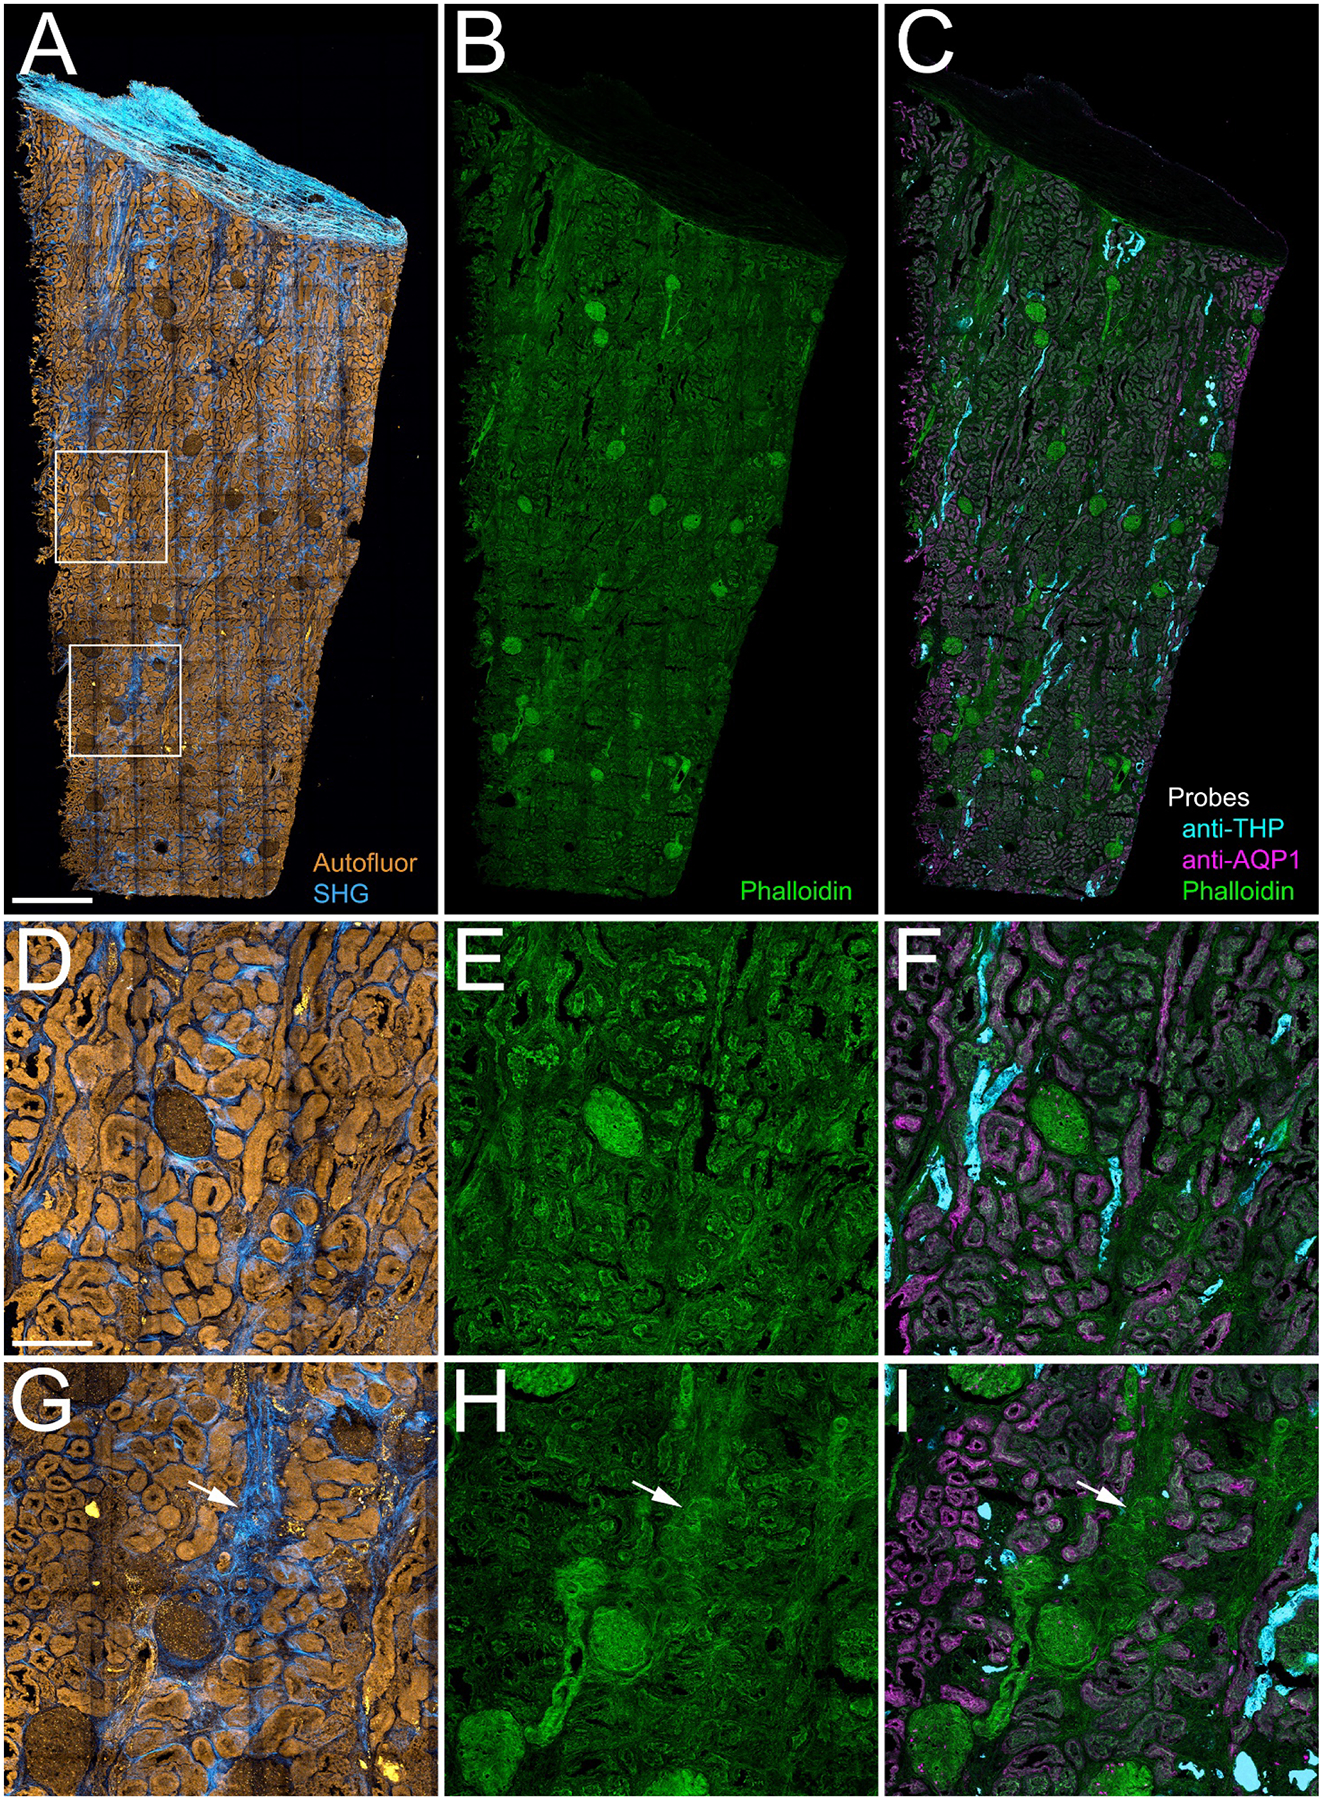
Figure 3. 3D confocal immunofluorescence of structural markers.

Panel A - Maximum projection of combined autofluorescence and SHG images. Panel B - Maximum projection of mosaic of confocal fluorescence image volumes of Oregon-Green phalloidin. Panel C - Overlay of maximum projection confocal fluorescence images of phalloidin (green) and antibodies to Tamm-Horsfall Protein (THP, cyan) and aquaporin-1 (AQP1, magenta). Panels D-F show corresponding 4X magnification images of the region indicated in the upper box in panel A, and panels G-I show corresponding 4X magnification images of the region indicated in the lower box in panel A. Arrows in panels G-I indicate regions of fibrosis and apparent tubular dropout. Scale bar in panel A represents 1 mm. Scale bar in panel D represents 250 microns.
