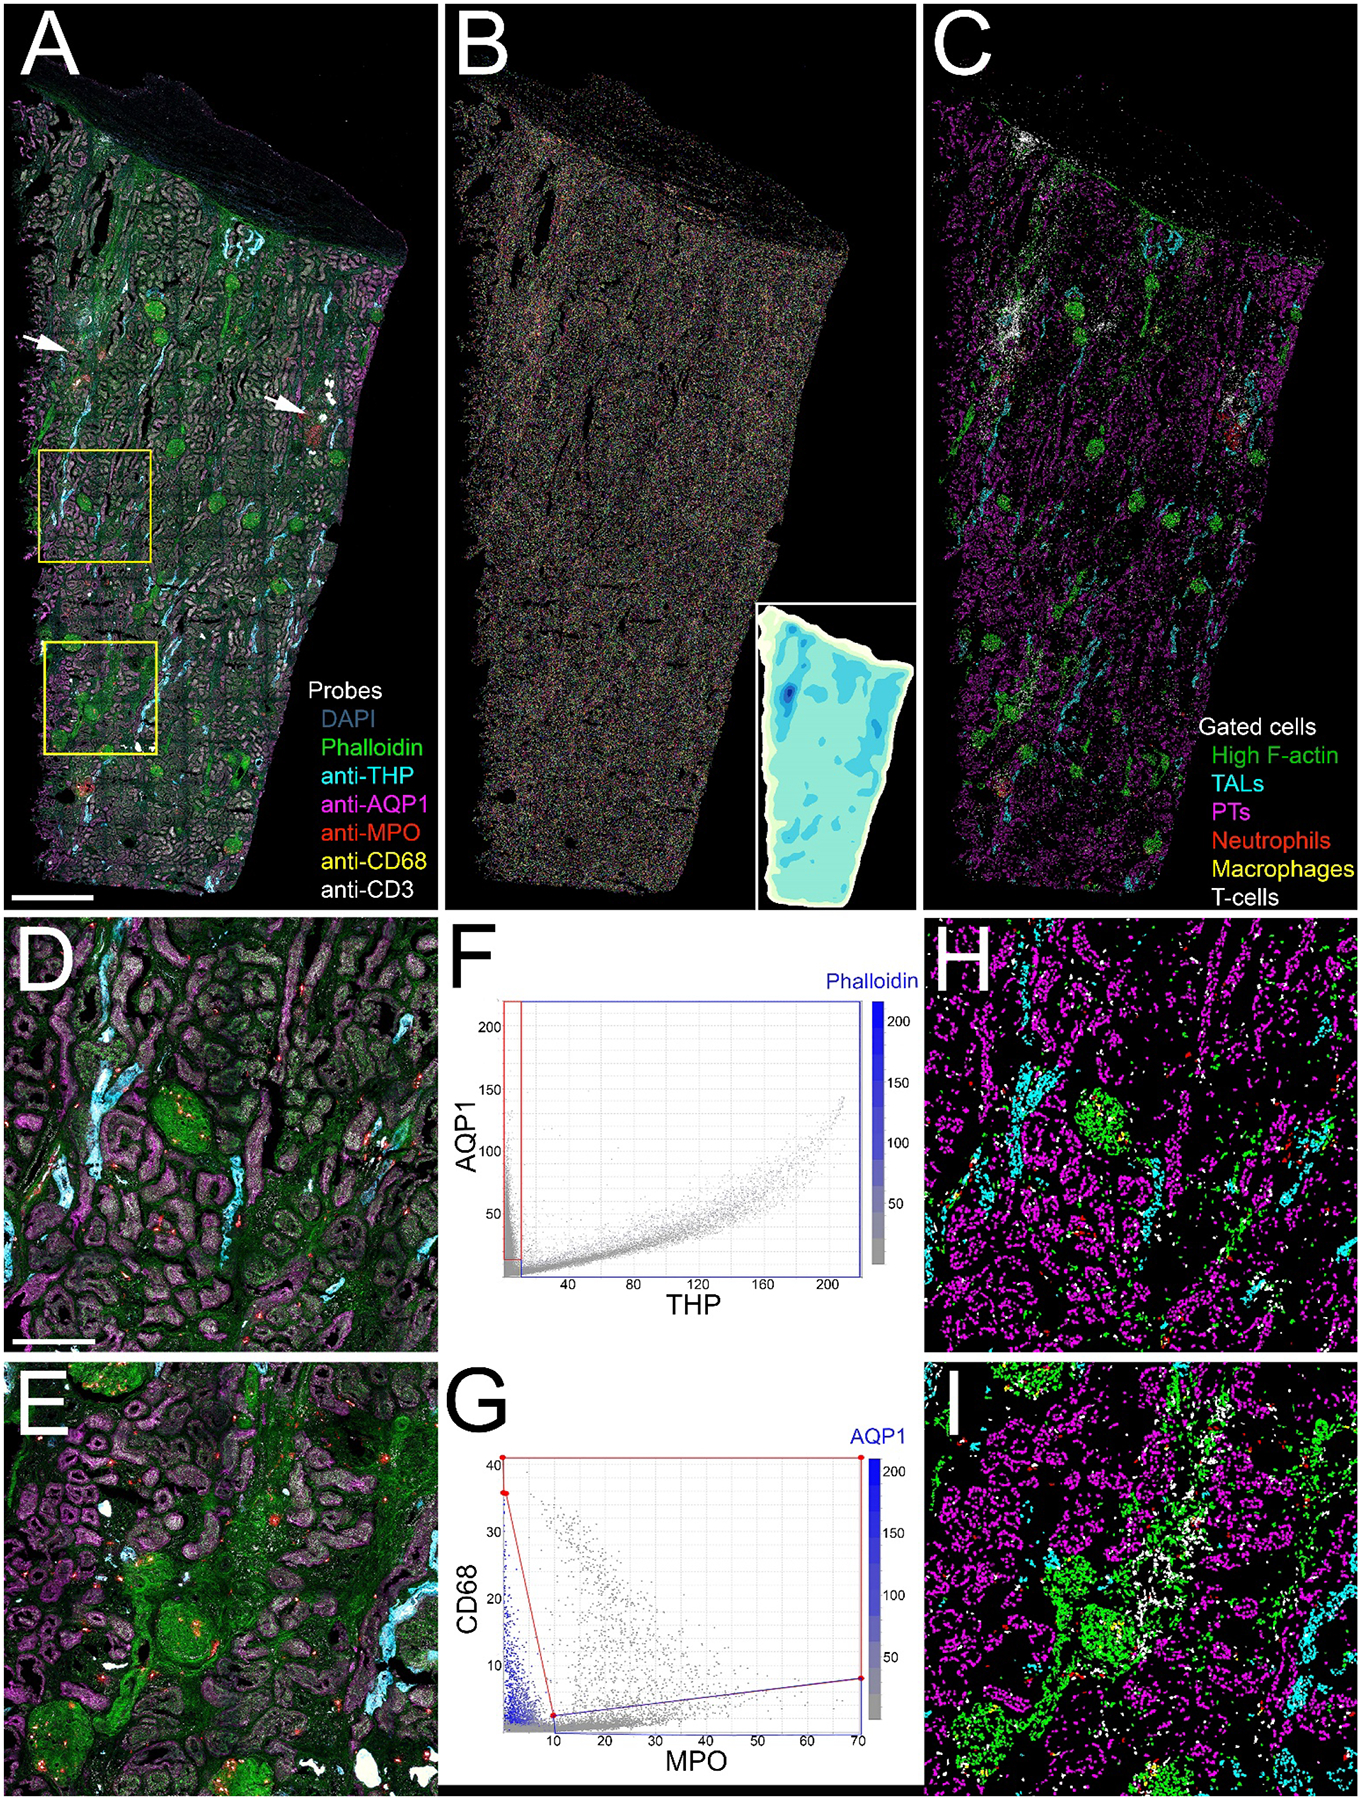
Figure 4. 3D confocal fluorescence microscopy and cytometry of structural and immune cell markers.

Panel A - Maximum projection of combined fluorescence images of DAPI (grey), phalloidin (green) and antibodies to THP (cyan), AQP1 (magenta), myeloperoxidase (MPO, red), CD68 (yellow) and CD3 (white). Arrows indicate two regions of immune cell infiltrates. (A video of a volume rendering of this volume is presented in Supplementary Video 1). Panel B - Projection of 3D image volume of binary map of nuclei following image segmentation using VTEA. Each segmented nucleus is presented in an arbitrary color. Inset is an isomap of cell density with darker colors depicting higher cell densities. Panel C - Distribution of different cell types following scatterplot gating. Green – phalloidin, Cyan – thick ascending limb, Magenta – proximal tubules. Red – neutrophils, Yellow – macrophages, White – T-cells. Panels D and E show corresponding 4X magnification images of the regions indicated in the two boxes shown in panel A. Panels F and G show scatterplots of the fluorescence intensity of THP vs. AQP1 and MPO vs. CD68, respectively. In each scatterplot, the color of each point represents the fluorescence intensity of a third probe (phalloidin and AQP1, respectively were chosen for these examples). Panels H and I show the locations of the different cell types in the regions shown in panels F and G, respectively, as determined by scatterplot gating. Scale bar in panel A represents 1 mm and 250 microns in panel D.
