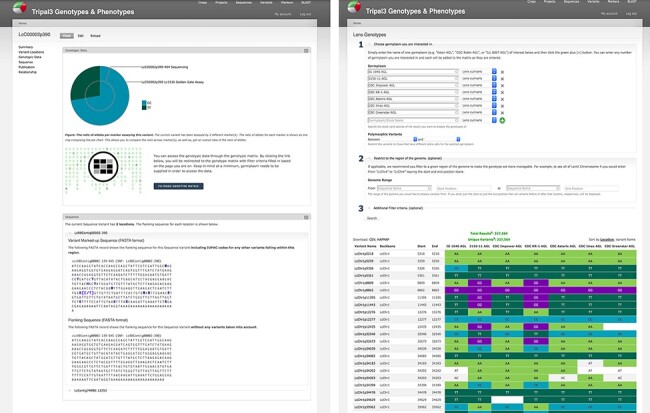
Figure 5.

Genotypic data visualization on a generic Tripal site. The left panel shows the distribution of alleles for the current variant as a pie chart (top), a link to the genotype matrix (middle) and the flanking sequence for the variant with known additional variants indicated by their IUPAC codes (bottom). The right panel shows the genotype matrix tool with the allele consensus for seven user-selected germplasm displayed in a variant by germplasm accession table. This table can be further filtered by pairwise polymorphism, genomic region as well as additional filter criteria.
