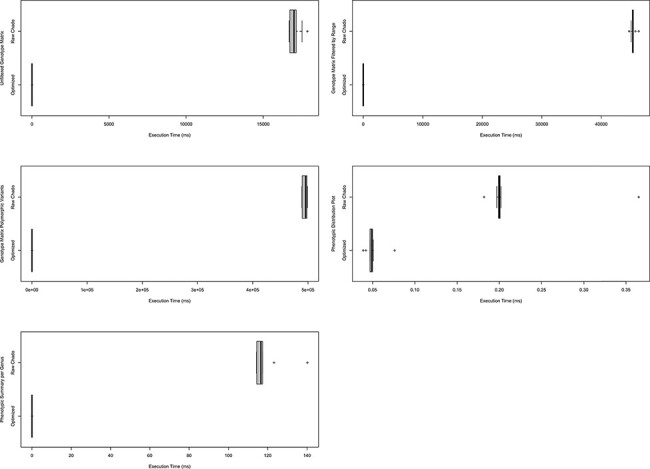
Figure 9.

Comparison of timings for functional queries on indexed materialized views versus Chado. The left column shows timings for genotypic data-focused queries and the right focuses on phenotypic data queries. Each box plot represents functionality in either Analyzed Phenotypes or ND Genotypes with the x-axis indicating the execution time of the query is milliseconds and the y-axis indicating the query performed. All box plots show the optimized form of the query was substantially faster than querying Chado directly. These timings were taken on a production database with nine replicates over the course of 1 day. Queries are fully described in Supplementary Data 1 and methods were described under Systems and Methods: Benchmarking.
