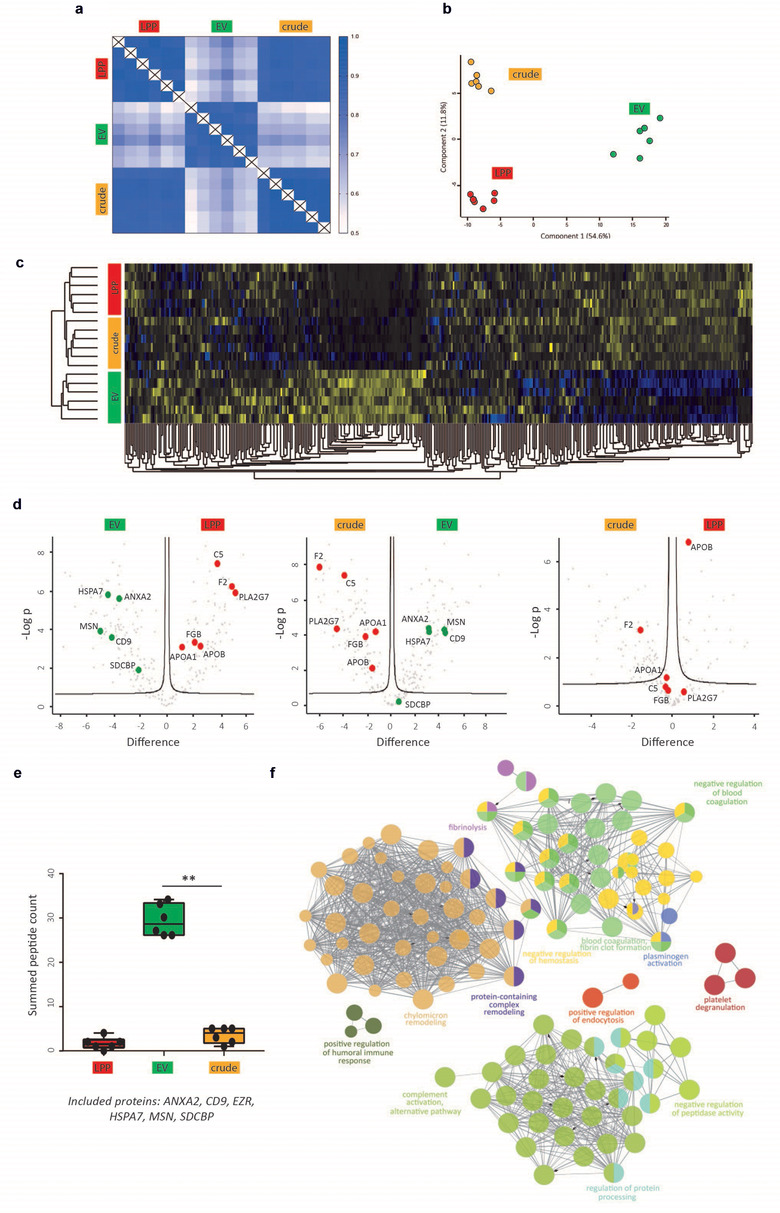
FIGURE 2.

Differential analysis of the protein landscape of crude, LPP and EV extracts. (a) Correlation matrix of LFQ protein intensities, (b) PCA and (c) unsupervised hierarchical clustering and heatmap analysis of the protein composition of crude, LPP and EV extracts (n = 6 technical replicates). (d) Volcano plot analysis revealing the differential expression of EV and non‐EV‐associated proteins in crude, LPP and EV extracts. (e) Summed peptide count of EV‐associated proteins (ANXA2, CD9, EZR, HSPA7, MSN and SDCBP) in crude, LPP and EV extracts (Mann‐Whitney U test, P = 0.0022). (f) Functional pathway analysis of the selected group of 83 putative non‐EV associated proteins
