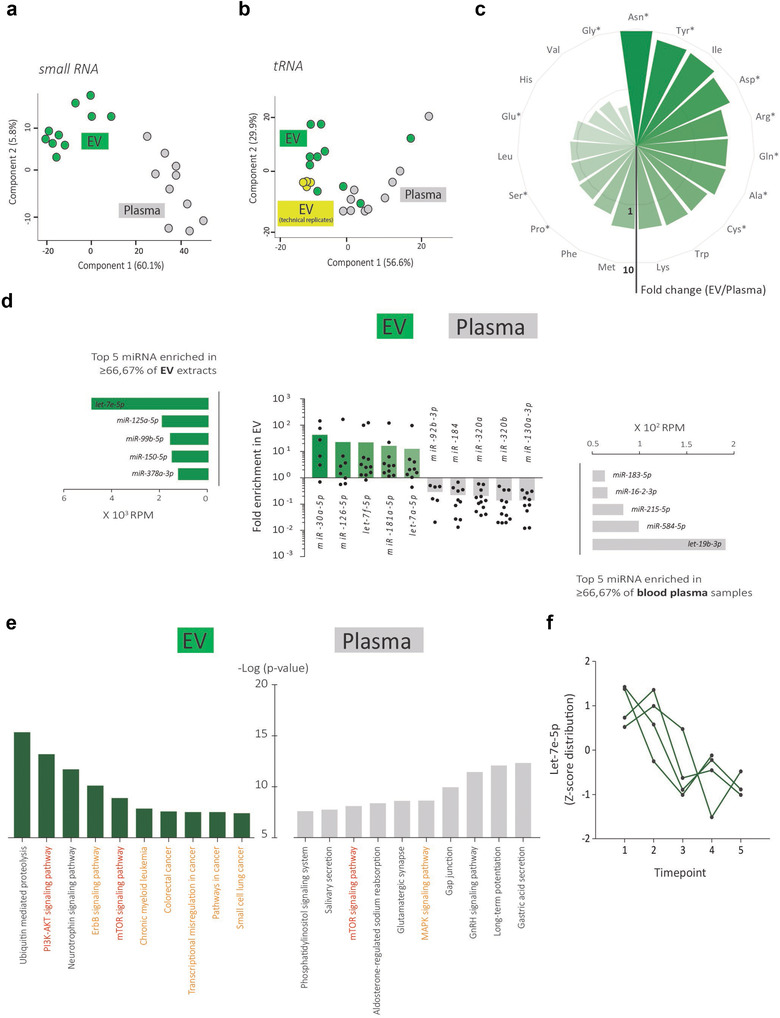
FIGURE 6.

Time‐dependent analysis of the EV small RNA landscape in serial blood plasma samples. (a) PCA of the small RNA composition and (b) tRNA fragment profile of matched EV extracts and total blood plasma samples of ovarian cancer patients (n = 2) over time (n = 5). The technical variability in the breast cancer plasma pool compared to biological variability in the tRNA fragment landscape is indicated in (b). (c) Circular barplot representing the fold change of the relative proportion of pooled tRNA fragments by amino acid codon usage in EV extracts compared to total blood plasma samples. Star indicates codon usage of non‐essential amino acids. Only tRNAs identified in ≥66.67% of all samples are included. (d) MiRNA analysis in matched EV extracts and total blood plasma samples. (e) KEGG pathway enrichment analysis of genes targeted by miRNAs most enriched in EV extracts or miRNAs most enriched in total blood plasma samples. (f) Z‐score distribution of let‐7e‐5p abundance in EV extracts over the collected time points of four ovarian cancer patients
