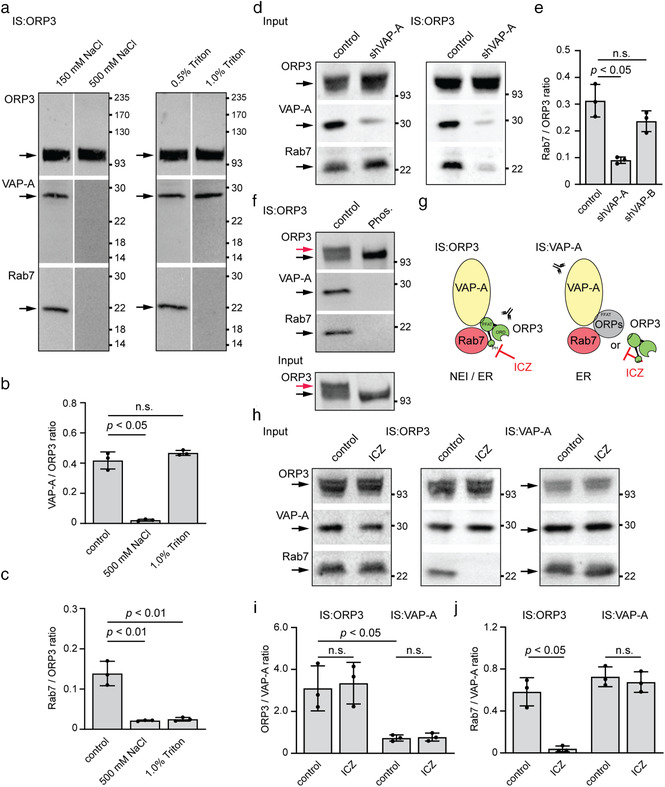
FIGURE 4.

ICZ disrupts the binding of ORP3 to Rab7, but not to VAP‐A. (a‐c) SW480 cells were solubilized in the presence of different concentrations of NaCl or Triton X‐100 as indicated prior to being subjected to immunoisolation (IS) using anti‐ORP3 Ab and Protein G‐coupled magnetic beads. The bound fraction was probed by immunoblotting for ORP3, VAP‐A and Rab7 (a). The ratio of protein immunoreactivities of the indicated pairs was quantified (b, c, n = 3). (d, e) Detergent lysates prepared from parental (scrambled control) and VAP‐A‐silenced (shVAP‐A) SW480 cells were processed as described in panel a. The input (1/50) and bound fractions were analysed by immunoblots (d). The ratio of protein immunoreactivities of the indicated pairs was quantified (e, n = 3; see Figure S4e for corresponding blot of SW480 shVAP‐B data). (f) The detergent lysate prepared from SW480 cells was divided into two aliquots and incubated without (control) or with λ‐phosphatase (Phos.) for 3 h prior to ORP3 immunoisolation and immunoblotting. It should be noted that there were no slower‐migrating ORP3 immunoreactive species after phosphatase treatment. (g) Diagram illustrating the tripartite protein complex interactions between VAP‐A (yellow), Rab7 (red) and ORP3 (green) or another oxysterol binding protein (OSBP)‐related protein (ORPs, grey) at the level of nuclear envelope invagination (NEI) and/or endoplasmic reticulum (ER). The PH, ORD and FFAT motifs found in ORP3 are indicated. Abs used for the IS are directed against either VAP‐A or ORP3. Note the possible molecular interaction target of ICZ. (h‐j) SW480 cells were incubated with DMSO alone (control) or 10 μM ICZ for 5 h, solubilized and subjected to IS using either anti‐ORP3 or anti‐VAP‐A Ab followed by Protein G‐coupled magnetic beads. The input (1/50) and entire bound fractions were probed by immunoblotting for ORP3, VAP‐A and Rab7 (h). The ratio of protein immunoreactivities of the indicated pairs was quantified (i, j, n = 3). For all immunoblots, molecular mass markers (kDa) are indicated. The arrows point to the proteins of interest while the red arrow (f) indicates specifically the hyperphosphorylated form of ORP3. For all graphs, the mean ± S.D. are shown. P values are indicated. N.s., not significant
