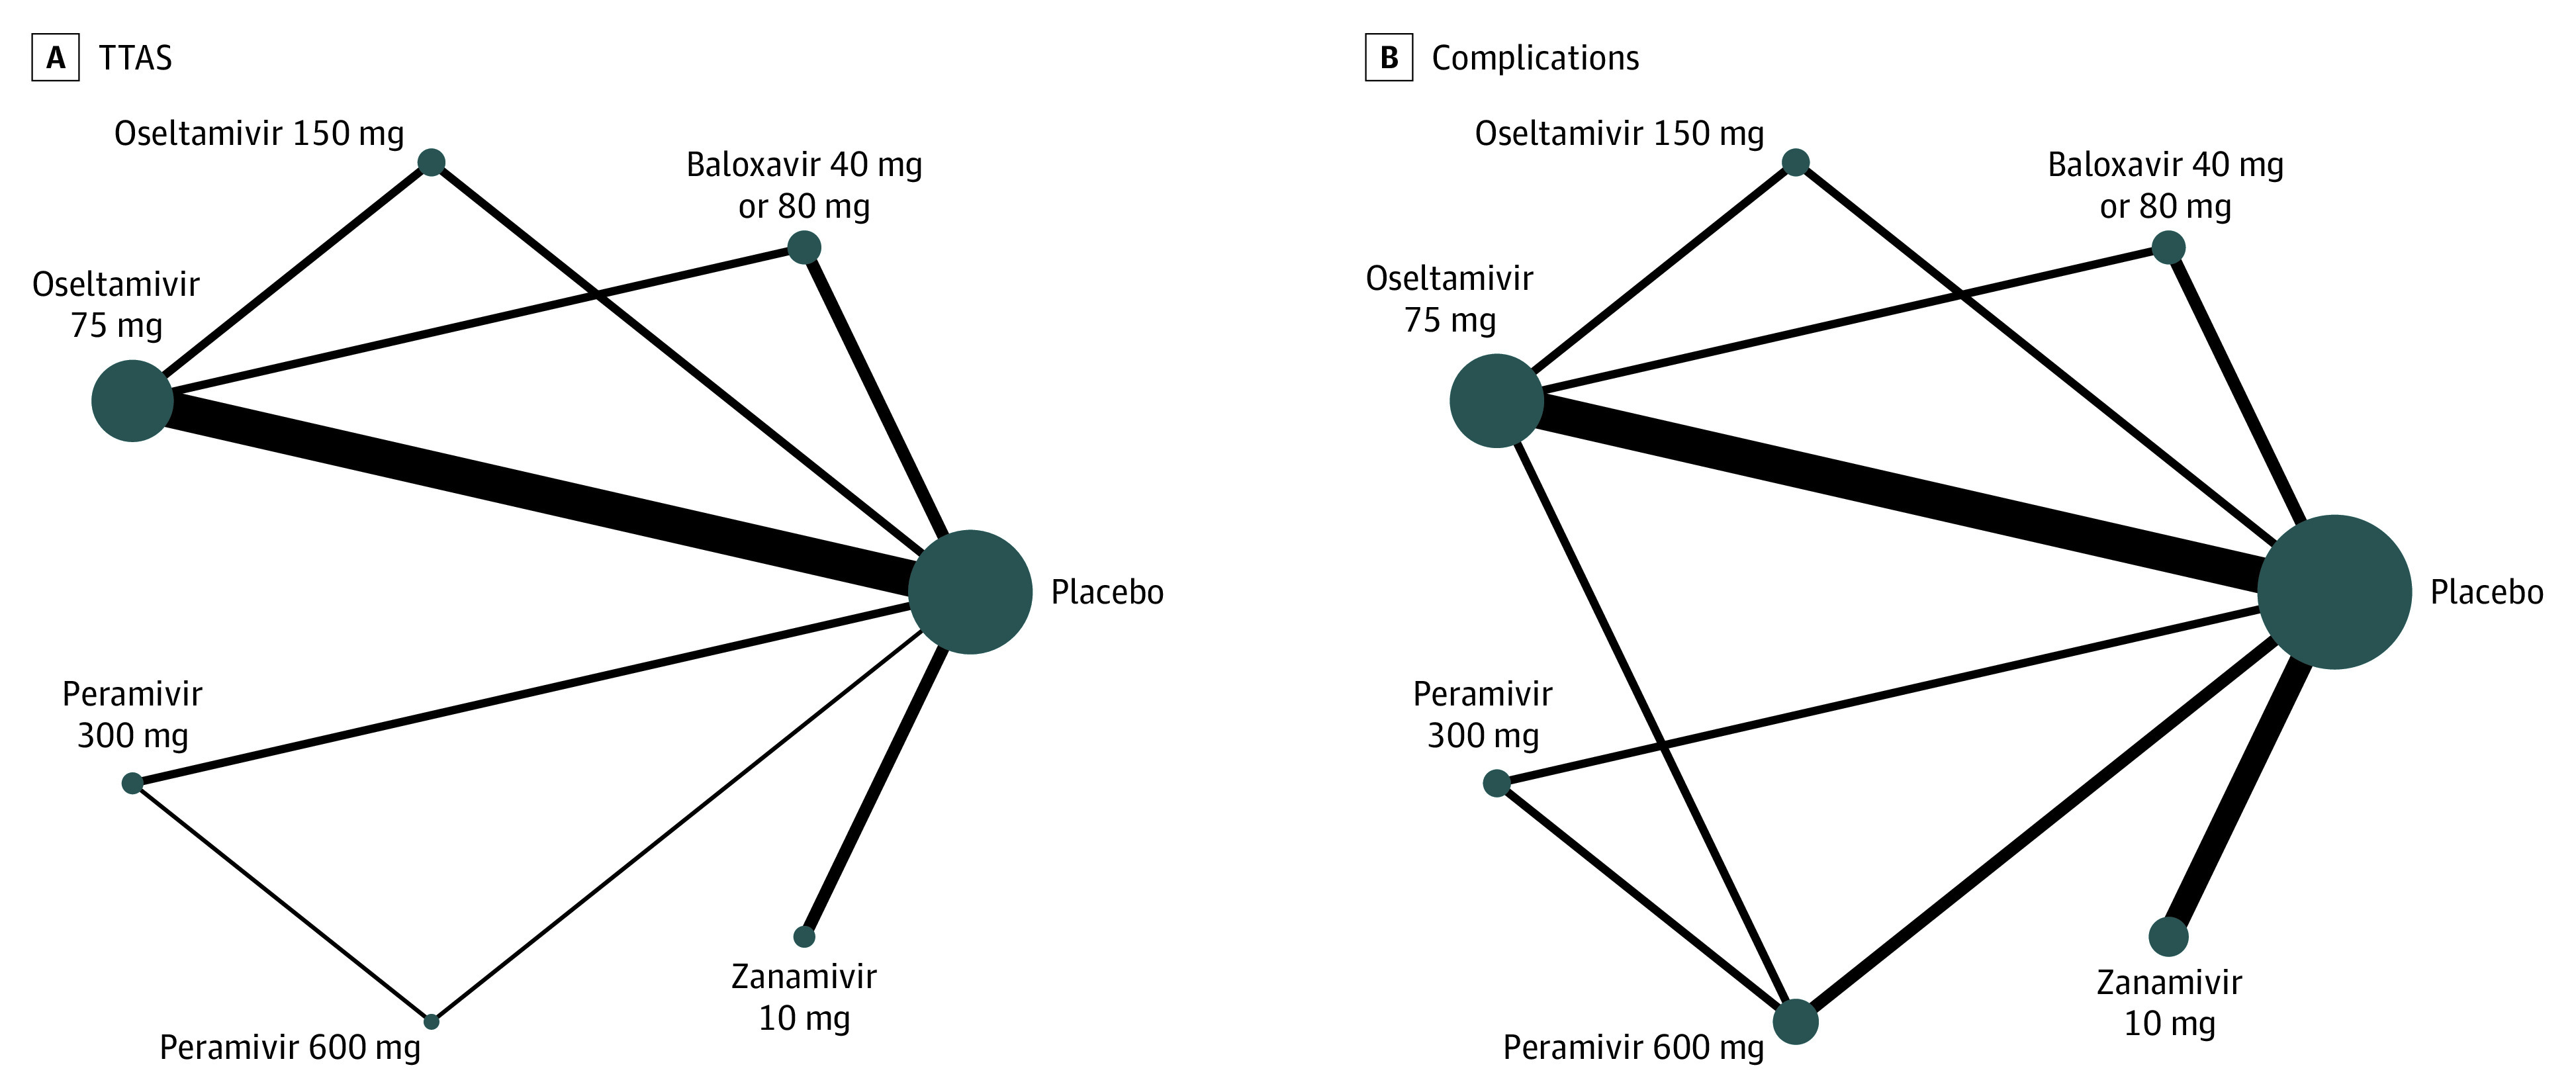
Figure 2. Network Graphs of Treatment Comparisons for Time to Alleviation of Influenza Symptoms and Complications.

Nodes indicate different active interventions or placebo; size of nodes, number of studies; thickness of lines between nodes, number of randomized participants contributing to direct comparisons.
