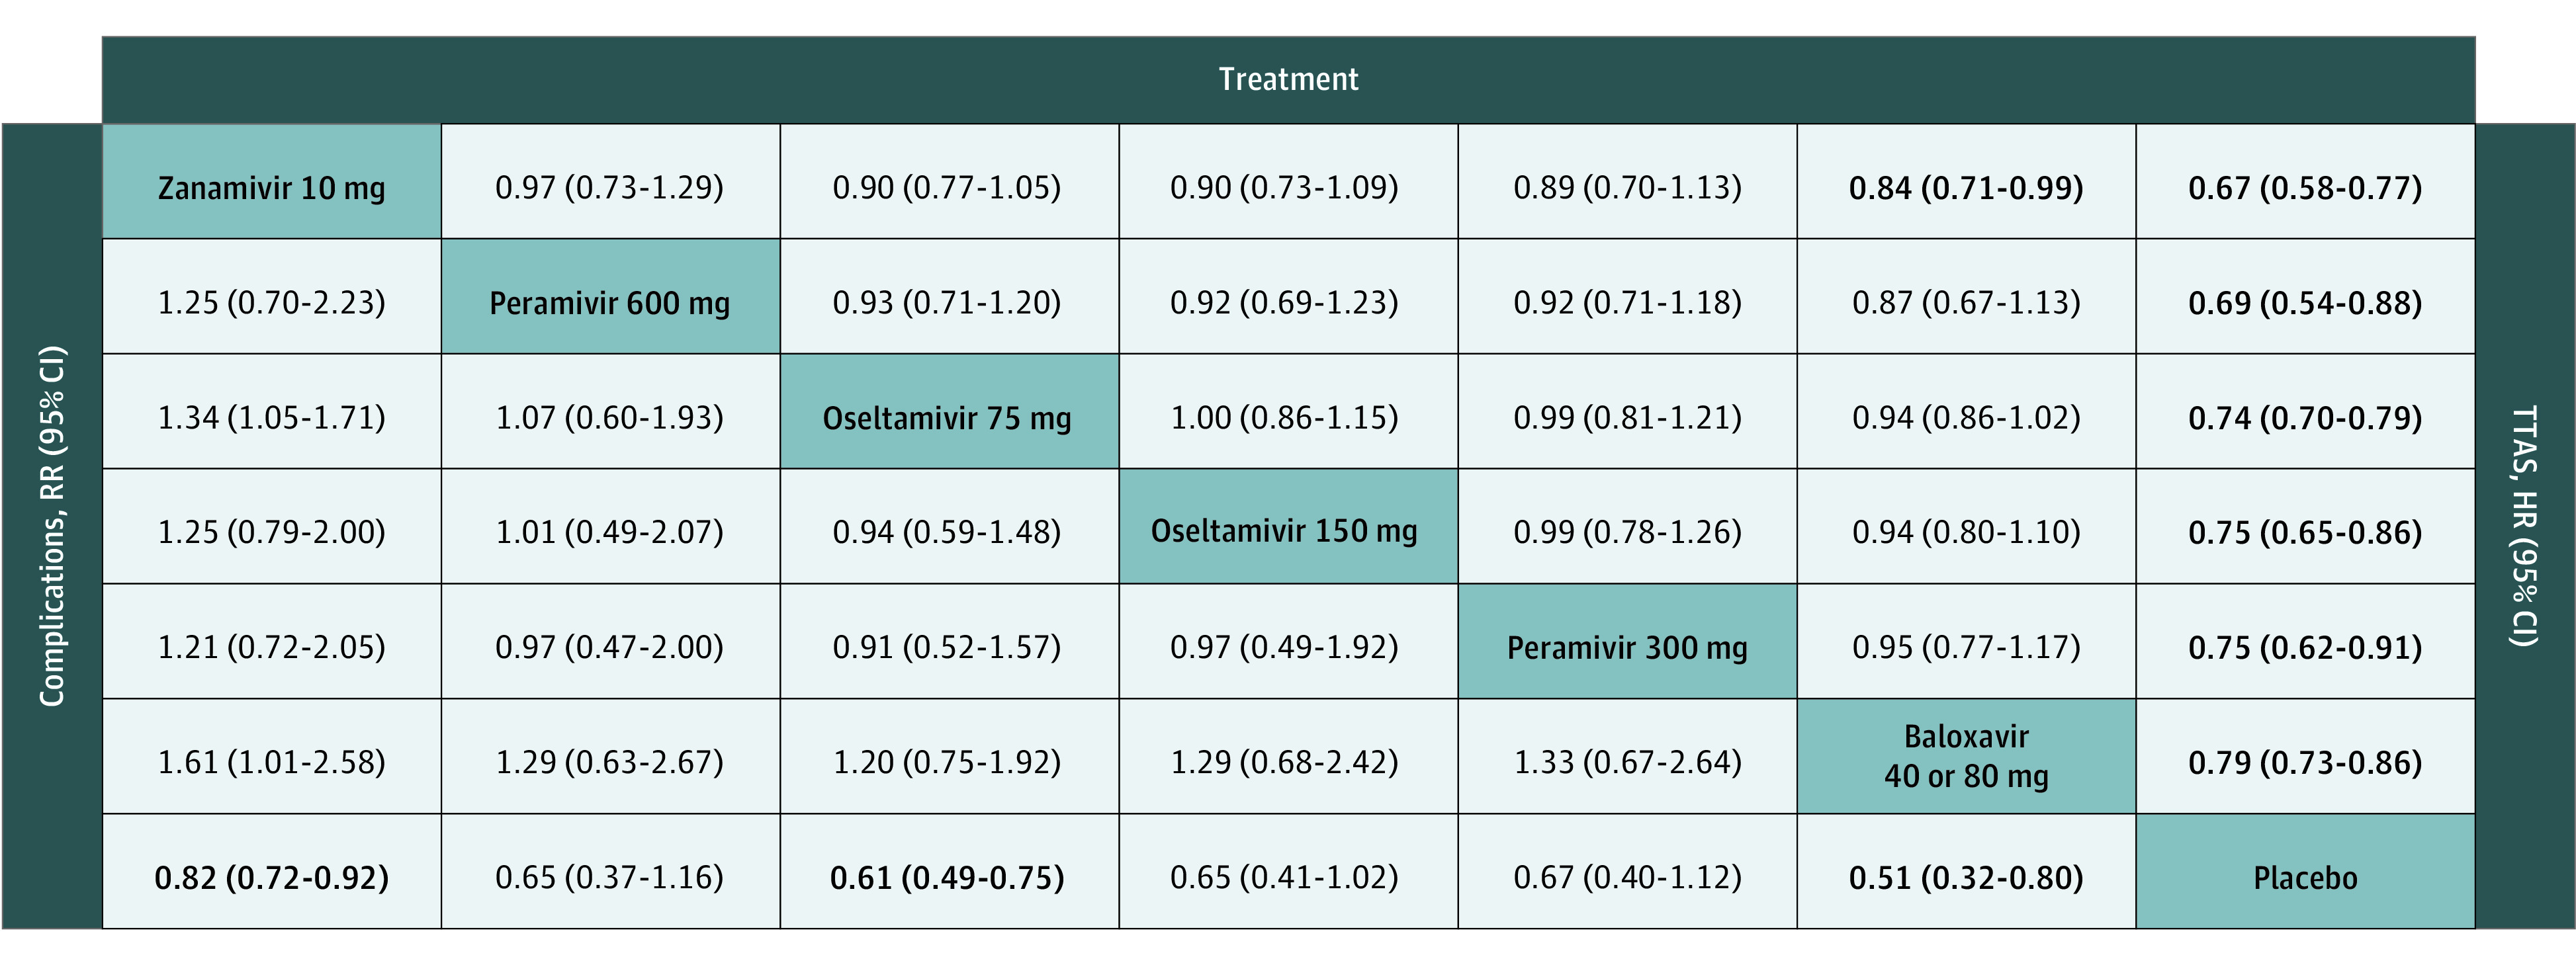
Figure 3. Network Meta-analysis Estimates of Time to Alleviation of Influenza Symptoms (TTAS) and Complications.

Effect sizes presented on the upper triangle correspond to hazard ratio (HR) (95% CI) of TTAS between the row and columns (eg, the HR of TTAS between zanamivir 10 mg and placebo is 0.97 [0.73-1.29]); On the lower triangle, effect sizes correspond to risk ratio (RR) (95% CI) of complications between the column and the row (eg, the RR [95% CI] of complications between zanamivir 10 mg and placebo is 0.82 [0.72-0.92]).
