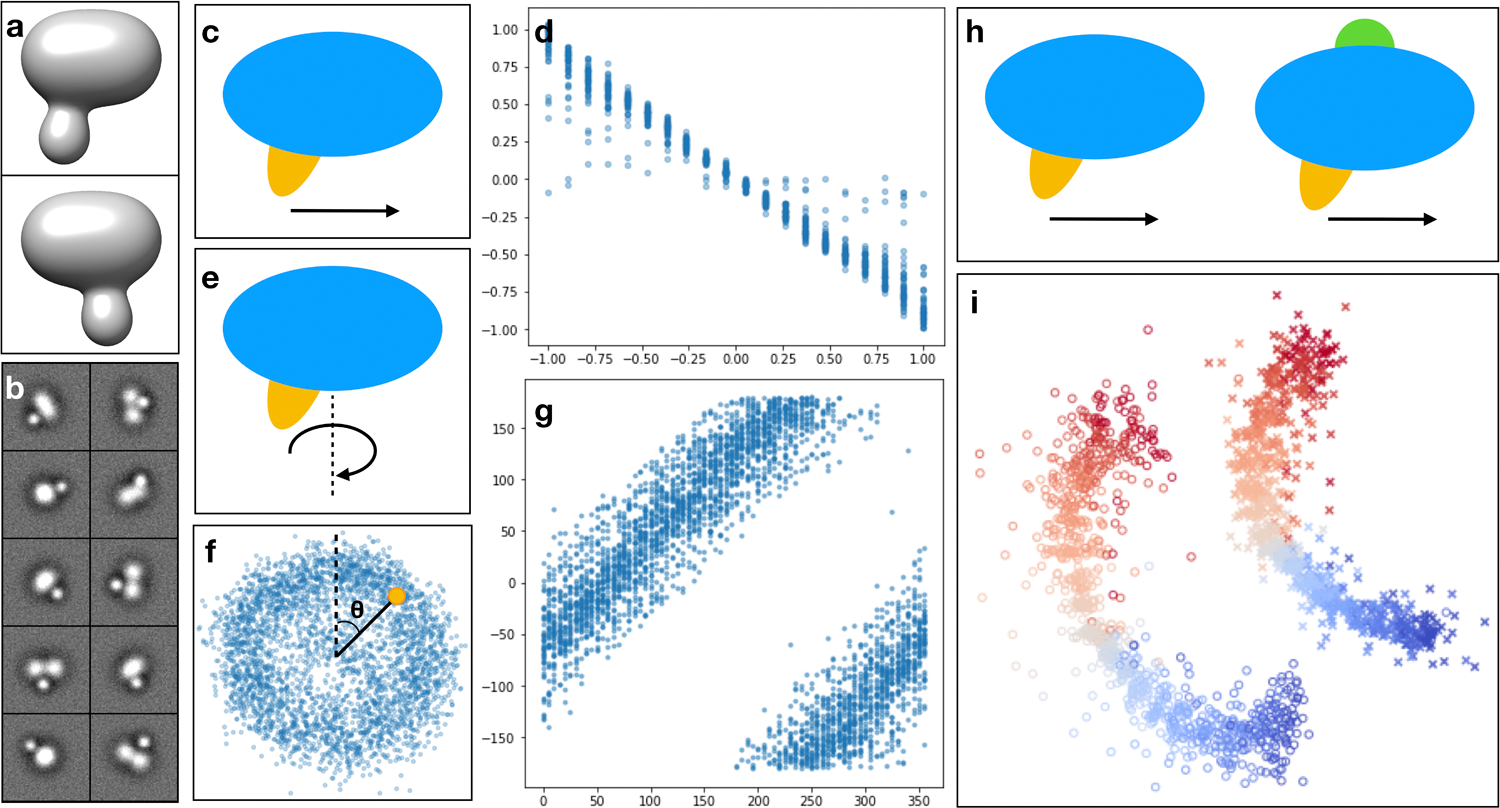
Extended Data Fig 5. Results on simulated datasets.

Results on simulated datasets. (a) 3D view of two snapshots of the simulated system at different frames of the movement trajectory. (b) Sample simulated particles. (c) Model of linear domain motion (yellow). (d) Scatter plot of the ground truth position vs estimated particle conformation of the linear domain movement. (e) Model of domain rotation around an axis. (f) Estimated particle distribution of (e) on the 2D latent space. (g) Scatter plot of the ground truth rotation angle vs estimated particle angle in the latent space (θ in f). (h) Combination of independent linear domain motion (yellow) and compositional change (green). (i) Particle distribution of (h) on the 2D latent space. Points are colored by their ground truth position along the linear domain motion trajectory. Particles with the extra density are marked as ‘x’, and the rest are marked as ‘o’.
