
Fig 4.
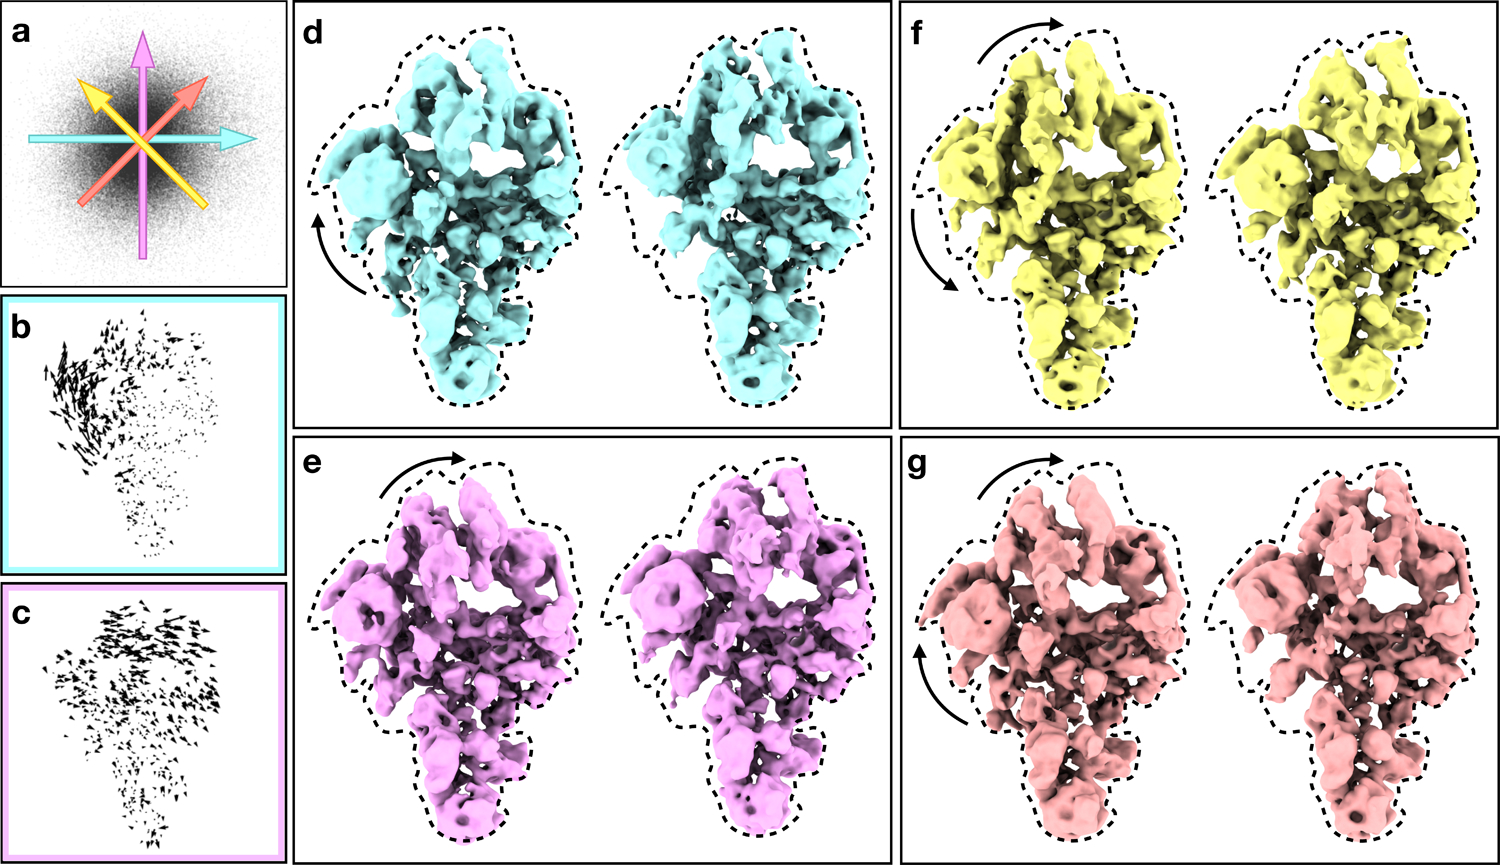
Structural variability analysis of spliceosome. (a) Distribution of particles in the 2D space formed by the selected base vectors. Colored arrows correspond to different motion trajectories shown in (d-g). (b-c) Motion trajectories of Gaussian coordinates from the two base vectors. Length of the vectors are exaggerated for better visualization. (d-e) Averaged structures reconstructed from particles along the two base vectors, showing the conformational change corresponding to (b-c) in 3-D. (f-g) Averaged structures reconstructed from particles along two different combinations of the base vectors, corresponding to the colored arrows in (a). Dotted envelopes are fixed to better visually judge variations between maps. See also supplementary movie 3.