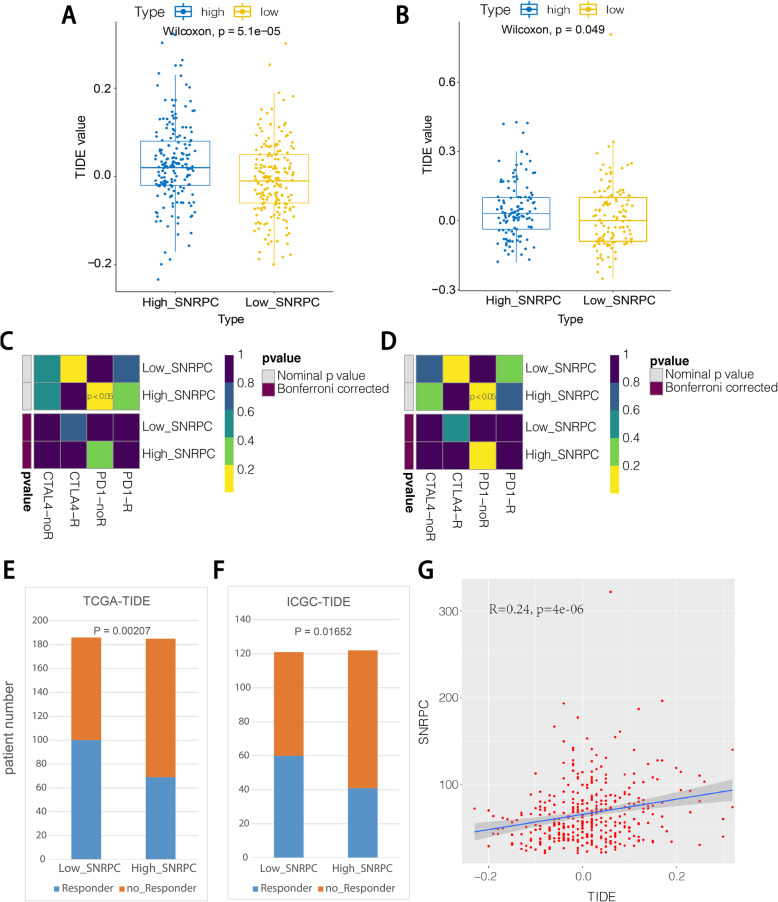
Fig. 6.
A TIDE scores of the high- and low-SNRPC groups using samples from the TCGA database. B TIDE scores of the high- and low-SNRPC groups using data from the ICGC database. C Immunotherapy responses between the high- and low-SNRPC groups in the TCGA database. D Immunotherapy responses between the high- and low-SNRPC groups in the ICGC database. E Proportion of patients who responded to immunotherapy in the high-SNRPC and low-SNRPC groups in the TCGA. F Proportion of patients who respond to immunotherapy in the high-SNRPC and low-SNRPC groups in the ICGC. G Correlation analysis between SNRPC expression and TIDE score

