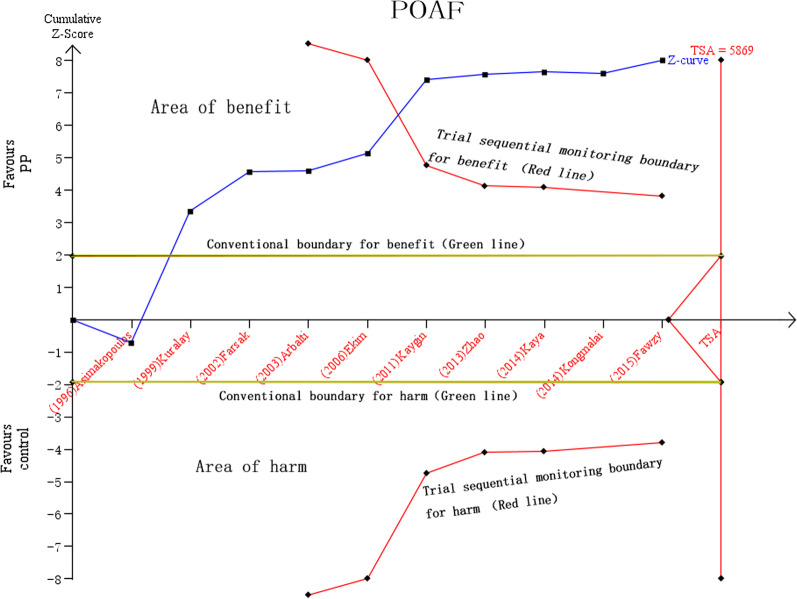
Fig. 4.
Trial sequential analysis of 10 RCTs (black square icons) illustrating that the cumulative z-curve crossed both the conventional boundary for benefit and the trial sequential monitoring boundary for benefit and entered the area of benefit, establishing sufficient and conclusive evidence and suggesting further trials are not needed. A diversity adjusted required information size of 5869 patients was calculated using an alpha error of 0.05, a beta error of 0.20 (power 80%), an anticipated RR reduction of 20% in AF, and a control event proportion of 25.3%, as calculated from the control group in our meta-analysis

