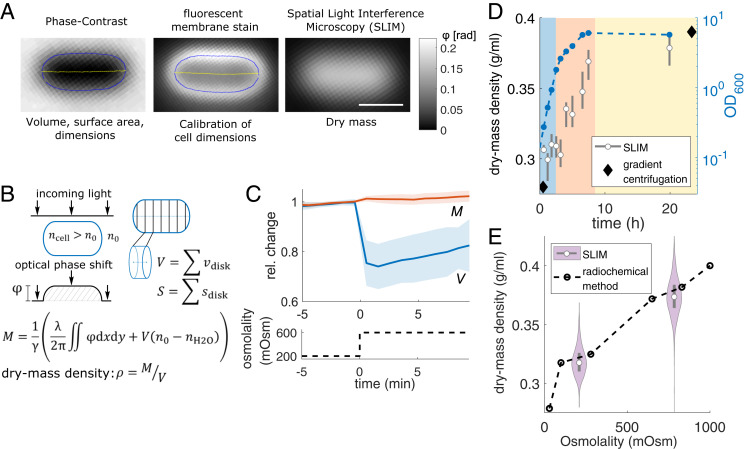
Fig. 1.
Measuring bacterial dry mass and volume using quantitative phase microscopy. (A) Snapshots of WT cell (MG1655) grown in MM + mannose in different imaging modalities (Top) used for different measurements (Bottom) with contour (blue) and centerline (yellow). The membrane dye FM4-64 stains predominantly the outer membrane (scale bar, 1 µm). (B, Left) Illustration of optical phase shift of light passing through a cell with refractive index . (Right) Volume and surface inference from calibrated two-dimensional cell contour. Dry mass M equals the optical phase shift, corrected for n0, divided by the refraction increment γ. (C) Relative changes of single-cell dry mass and volume (mean ± SD) during hyperosmotic shock (Top) and medium osmolality (Bottom). Since cell volume is inferred from phase-contrast images, the volume is possibly underestimated due to potential shrinkage of the cytoplasm. (D) Dry-mass density and optical density (OD600) during exponential growth (blue shade), during early (red), and during late (yellow) stationary phase in Luria Bertani (LB) Miller medium (MG1655 at 30 °C). Growth phases were annotated according to OD600. Comparison to values inferred from wet-mass densities (diamonds) (29). (E) Dry-mass density increases with osmolality in MM + glucose (MG1655 at 37 °C), comparing SLIM and radiochemical-free water measurements (dashed line) (30) (gray rectangles = interquartile range; white circles = median; for numbers of cells see Table S2).

