Fig. 2.
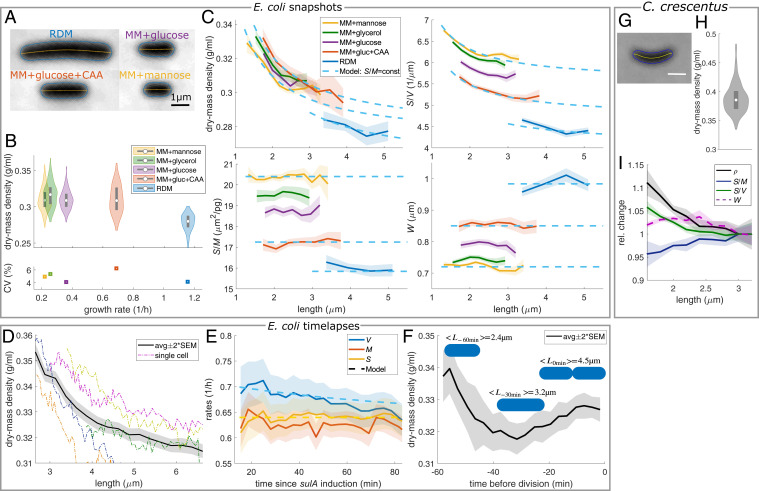
Cells increase cell-surface area but not cell volume in proportion to dry mass. (A and B) Snapshots of nondividing WT cells (MG1655) in different media at 30° C. (A) Phase-contrast images. (B) Dry-mass density (white circles = median; gray rectangles = interquartile range) and CV. (C) Length dependencies of dry-mass density, surface-to-volume ratio, surface-to-mass ratio, and width. Dashed lines: model prediction for spherocylinder with constant and . (D and E) Timelapse of filamenting cells (S290) in MM + glucose + CAA. (D) Length dependency of dry-mass density. (E) Relative rates of volume, mass, and surface area () and model (dashed line). (F) Dry-mass density during time lapse of dividing cells (MG1655) in MM + glucose + CAA. (G–I) Snapshots of nondividing C. crescentus cells (CB15) grown in PYE. (G) Phase-contrast image. (H) Dry-mass density distribution as in B. (I) Length dependency of normalized dry-mass density, surface-to-mass and surface-to-volume ratios, and width in nondividing cells (solid lines + shadings = average ± 2 × SEM).

