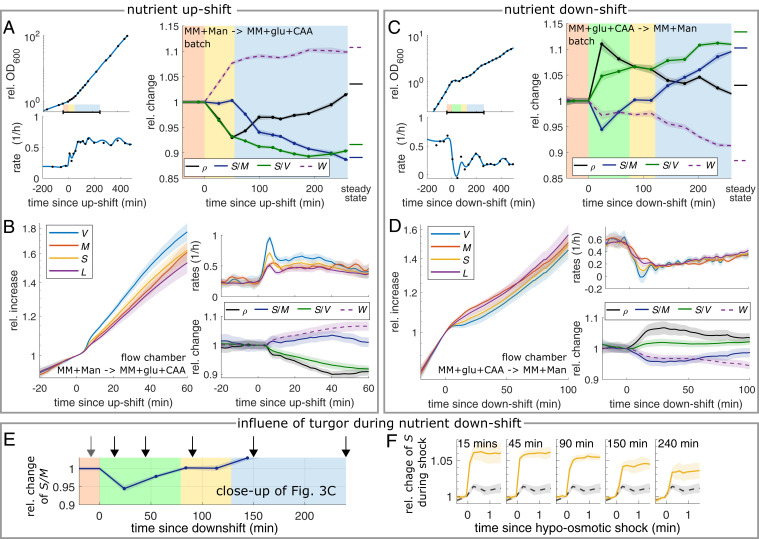
Fig. 4.
Nutrient shifts confirm robust surface-to-mass coupling on the generation time scale, despite variations of growth rate, dry-mass density, and turgor. (A) Nutrient upshift from MM + mannose to MM + glucose + CAA in batch culture of WT cells (MG1655). (Left) Growth curve and relative rate. (Right) Relative changes of dry-mass density, surface-to-mass and -volume ratios, and width from single-cell snapshots. Shaded backgrounds: prior to shift (red), S/M constant (yellow), and S/M approaching new steady state (blue). (B) Single-cell timelapse of the same nutrient shift as in A applied to filamenting cells (S290) in flow chamber. Relative increase (Left) and single-cell rates (Top Right) of volume, mass, surface, and length. (Bottom Right) Same quantities as in A. (C and D) Nutrient downshift from MM + glucose + CAA to MM + mannose in batch culture (D) and flow chamber (E). Otherwise same conditions as in A and B. Shaded backgrounds: for red, yellow, and blue, see A; green: S/M is decreased due to turgor pressure drop. (E and F) Hypo-osmotic shocks (250 mOsm, through 10× dilution of growth medium) of WT cells measured at different time points after a nutrient downshift as in C. (E) Average of S/M already shown in C, with arrows indicating time points of sample preparation for osmotic shocks in flow chambers. (F) Relative change of surface area at different time points (solid, yellow) in comparison to control before nutrient shift (dashed, black) (SI Appendix, Table S4 has conversion factors to absolute values; solid lines + shadings = average ± 2 × SEM of n > 460 cells (up-shift) and n > 88 cells (down-shift) per time point).

