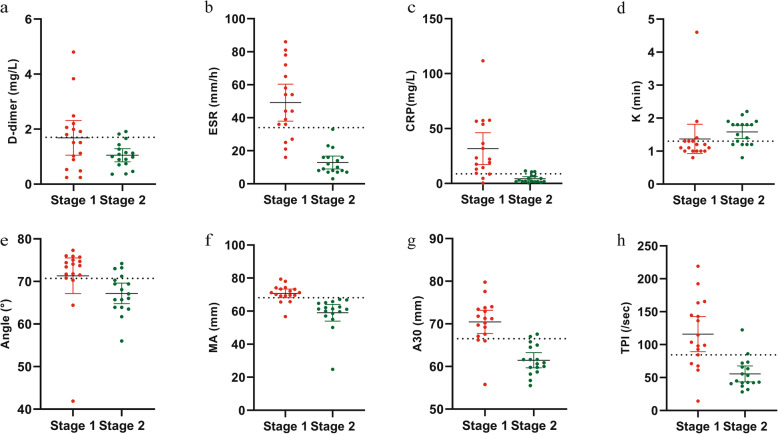
Fig. 2.
The distributions of D-dimer (a), ESR (b), CRP (c), K (d), Angle (e), MA (f), A30 (g), and TPI (h) levels before and after the first staged revision surgery. Stage 1: Stage before spacer insertion. Stage 2: Stage after re-admission for the second stage. Dotted lines represent the optimal cutoff values based on the present study. ESR, erythrocyte sedimentation rate; CRP, C-reactive protein; K, clotting time; Angle, α-angle; MA, maximum amplitude; A30, amplitude at 30 min; TPI, thrombodynamic potential index

