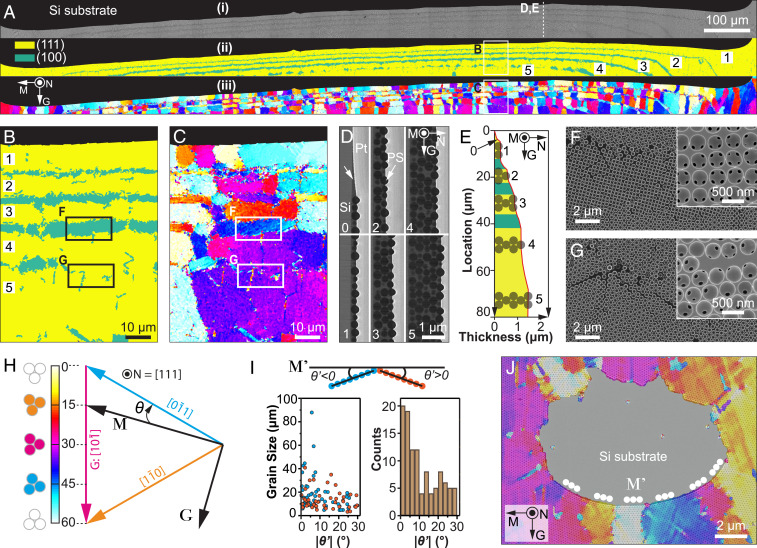
Fig. 2.
Morphological and crystallographic analysis of the initiation region. (A) (i) Original SEM image, (ii) corresponding lattice type map, and (iii) orientation map of a typical initiation region. The number of layers in the colloidal crystal gradually increases from one to five, as indicated in ii. (B and C) High-magnification maps of (B) lattice type and (C) orientation for a representative region indicated in A. (D) SEM images of FIB-milled cross-sections, demonstrating regions with a different number of layers: 0, submonolayer; 1, one layer; 2, two layers; etc. (E) The thickness profile of the colloidal crystal at the initiation region. (F) Transition zone from three-layer to four-layer region, demonstrating that the lattice type changes from a hexagonal to square to hexagonal packing. (G) Transition zone from four-layer to five-layer region, demonstrating that the crystal orientation is maintained. Insets in F and G show the corresponding structure after calcination. The regions of F and G were taken from B and C as indicated. (H) The color scheme used in orientation maps. The crystal angle, θ, is defined as the angle between the top left−bottom right−oriented [110] direction (i.e., direction) and the global meniscus direction (M). (I) (Top) The local crystal misorientation angle, θ′, is defined as the angle between the local meniscus orientation (M′) and the nearest close-packed orientation, and the positive and negative signs are assigned according to the schematic diagram. (Bottom) The distribution of grain sizes and local crystal misorientation (θ′) based on statistical analysis of the orientation map shown in A. (J) An overlay of an original SEM image and orientation map shows an extreme example of a defect region with highly curved meniscus orientations, which are always aligned with the close-packed orientations locally (i.e., θ′ ≈ 0°). All orientation maps are based on the same color scheme, shown in H. All images except D and E were in the same sample orientation as in A.

