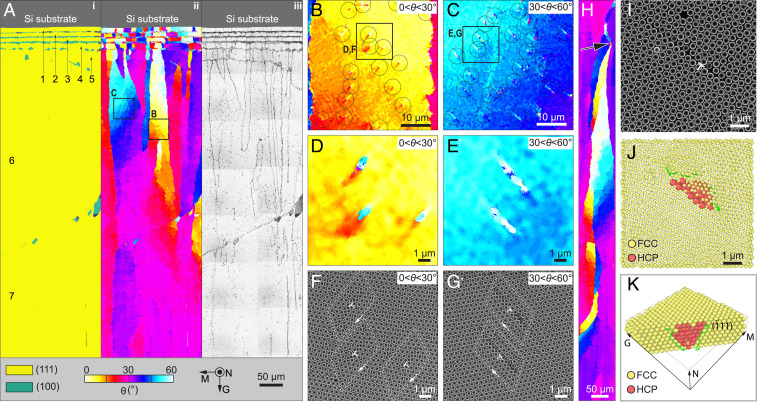
Fig. 3.
Evolution of crystallographic orientation during growth. (A) Large-area maps of (i) lattice type, (ii) corresponding orientation, and (iii) defects, demonstrating gradual rotation of crystallographic orientation along the growth direction. The number of layers is indicated, and a maximum of seven layers is observed at the lower portion of this region. (B and C) Enlarged orientation maps with local crystal orientation in the range of (B) 0° < θ < 30° and (C) 30° < θ < 60°, which are acquired in the regions as indicated in A. The circles highlight individual defects. (D and E) High-magnification of orientation map and (F and G) corresponding original SEM images showing the individual defects, which are acquired in the regions as indicated in B and C. In F and G, the dislocation cores are indicated by ; the white loops indicate Burgers circuits. (H) Orientation map acquired in a region where the preferred <110> growth has been achieved, showing a self-correction behavior. The crystallographic orientation rotates back to θ = 30° after a defect causes crystallographic misorientations (arrow). (I) Top-view SEM image of a region with a dislocation (indicated by ) selected for tomography analysis. (J) Top-view reconstruction of the same region. The red particles represent a stacking fault within the fcc lattice, which is represented with a smaller particle radius for ease of viewing. (K) Crystal reconstruction in a perspective view with front particles removed. All the orientation, phase, defect map, and SEM images are in the same orientation and color scheme as in A.

