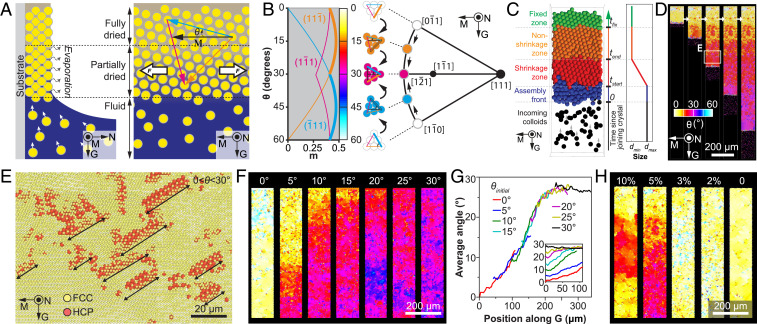
Fig. 4.
Mechanism of crystallographically preferred growth. (A) Schematic diagram of the evaporation and associated self-assembly process. A horizontal (i.e., along meniscus direction) tensile stress is generated during the drying process of the colloidal assemblies. (B) (Left) Determination of Schmid factor, m, as a function of colloidal crystal orientation, θ. Here only the three slip directions with the highest m values for the three close-packed planes (, , and ) are displayed. (Right) A (111) stereographic projection showing the gradual crystal rotation toward the growth. (C–H) Results of the colloidal self-assembly modeling approach: (C) (Left) Schematic diagram of the evaporation-induced colloidal assembly modeling. (Right) The particle size profile used in the simulations; tstart and tend specify the time range over which the particle size reduces from dmax to dmin; tfix is the time when the particle becomes fixed. (D) A representative simulation result showing the gradual crystallographic rotation. (E) Detection of stacking faults due to the generation of dislocations at the growth front. The location of this volume is highlighted in D. (F) Effects of initial crystal orientation, θinitial = 0°, 5°, 10°, 15°, 20°, 25°, and 30°. (G) Profile of average crystal angles along the growth direction, G. (H) Effects of particle shrinkage, s = 1 – dmin/dmax = 10%, 5%, 3%, 2%, and 0%.

