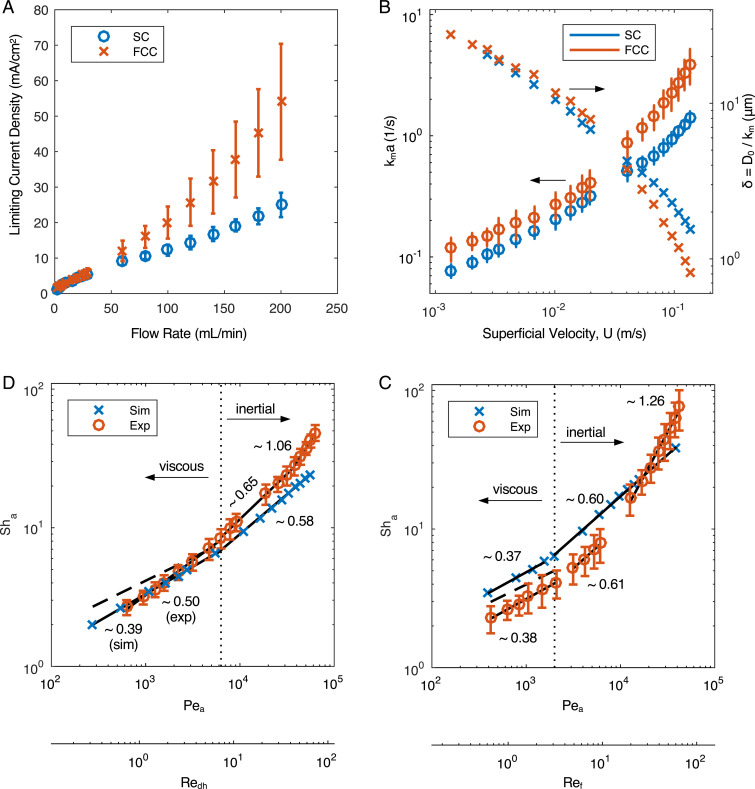
Fig. 2.
Mass transport in 3D-printed electrodes. (A) Limiting current density over the frontal area of the disk electrode represented as mean SEM in the SC and FCC electrodes against the imposed flow rate. Experiments were performed using mM. See SI Appendix, Fig. S9 for corresponding reactant conversion calculation. (B) The mass transfer coefficients (left axis) and boundary layer thickness estimate (right axis) for the FCC and SC electrodes are plotted as a function of superficial velocity. (C and D) The mass transfer coefficients are transformed into the Sherwood number experimental data for the (C) FCC and (D) SC. The solid lines are power-law fits to the data with the exponent as labeled in the plot. The dashed lines in and C and D are the correlations in Eqs. 4 and 5, respectively.

