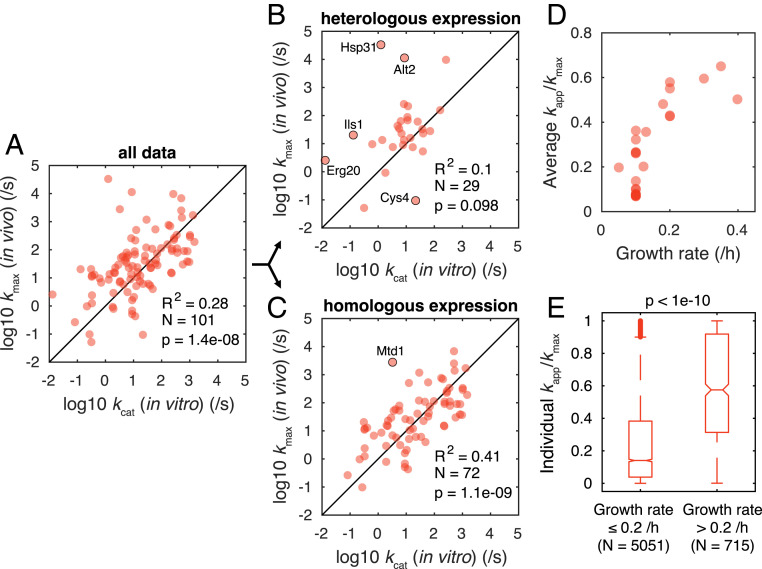
Fig. 1.
Analysis of kapp and kmax of S. cerevisiae. Correlation in log scale between kmax and in vitro kcat for all data points (A) and for the data points in which in vitro kcat were measured using enzymes obtained through heterologous expression (B) and through homologous expression (C). The data points with deviations more than two orders of magnitude are labeled by the enzyme names. Student’s t test was used to calculate P value for Pearson’s correlation. (D) Change in average kapp/kmax of each condition with growth rate. (E) Comparison between kapp/kmax of individual reactions in two groups divided by a growth rate of 0.2/h. A two-sided Wilcoxon rank sum test was used to calculate P value.

