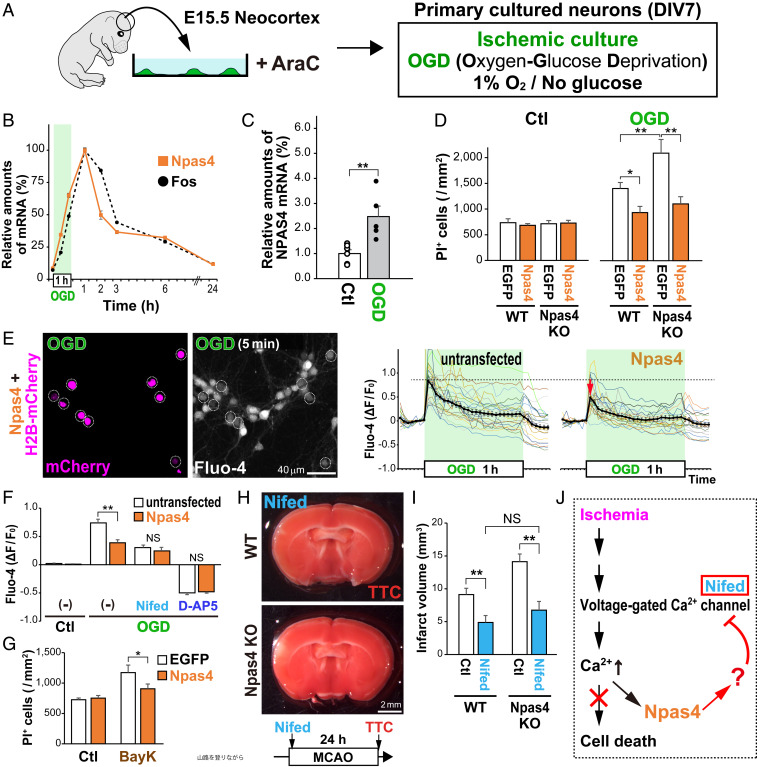
Fig. 4.
Npas4 expression inhibits excess Ca2+ influx into ischemic neurons. (A) Schematic drawing of primary cultured neurons exposed to ischemia-like OGD. (B) qRT-PCR for relative amounts of Npas4 or Fos messenger RNA (mRNA) in primary neurons after 1 h of OGD. (C) qRT-PCR for relative amounts of NPAS4 mRNA 1 h after OGD in human brain organoid cultures generated from induced pluripotent stem cells. (D) Numbers of dead cells in either Npas4-overexpressing or Npas4-deficient neurons after OGD. Primary neurons prepared from WT or Npas4 KO embryonic cortexes were transfected with AAV/CMV–EGFP or AAV/CMV–Npas4 24 h before OGD. Dead cells were stained with PI 24 h after OGD. (E) Ca2+ imaging during OGD in primary neurons electroporated with plasmids carrying H2B-mCherry and Npas4. Dotted circles indicate H2B-mCherry–transduced cells (E, Left). Graphs on the right indicate Fluo-4 intensities (ΔF/F0) of Npas4-overexpressing neurons (H2B-mCherry– and Npas4-transfected; Npas4) relative to those of surrounding untransfected neurons (untransfected) during the 1-h OGD. (F) Graph shows Fluo-4 intensities of Npas4-overexpressing neurons relative to those of surrounding untransfected neurons 5 min after the onset of OGD in the presence or absence of Nifed (an inhibitor of L-type VGCCs) or D-AP5 (an inhibitor of the NMDA receptor). (G) Numbers of dead cells in Npas4-overexpressing and control neurons (transfected with AAV/CMV–EGFP and AAV/CMV–Npas4, respectively) after VGCCs were activated with BayK for 5 min. Dead cells were stained with PI 24 h after BayK treatment. (H and I) In vivo neuroprotective effects of Nifed in WT and Npas4 KO mice undergoing MCAO. Living cells were stained with TTC 24 h after MCAO (H) to calculate the infarct volume (I). (J) Schematic drawing of the deduced function for Npas4 in ischemic neurons. *P < 0.05, **P < 0.01, NS: not significant (Student’s t test in C and two-way ANOVA with post hoc Tukey’s test in D, F, G, and I).

